Fig. 1.
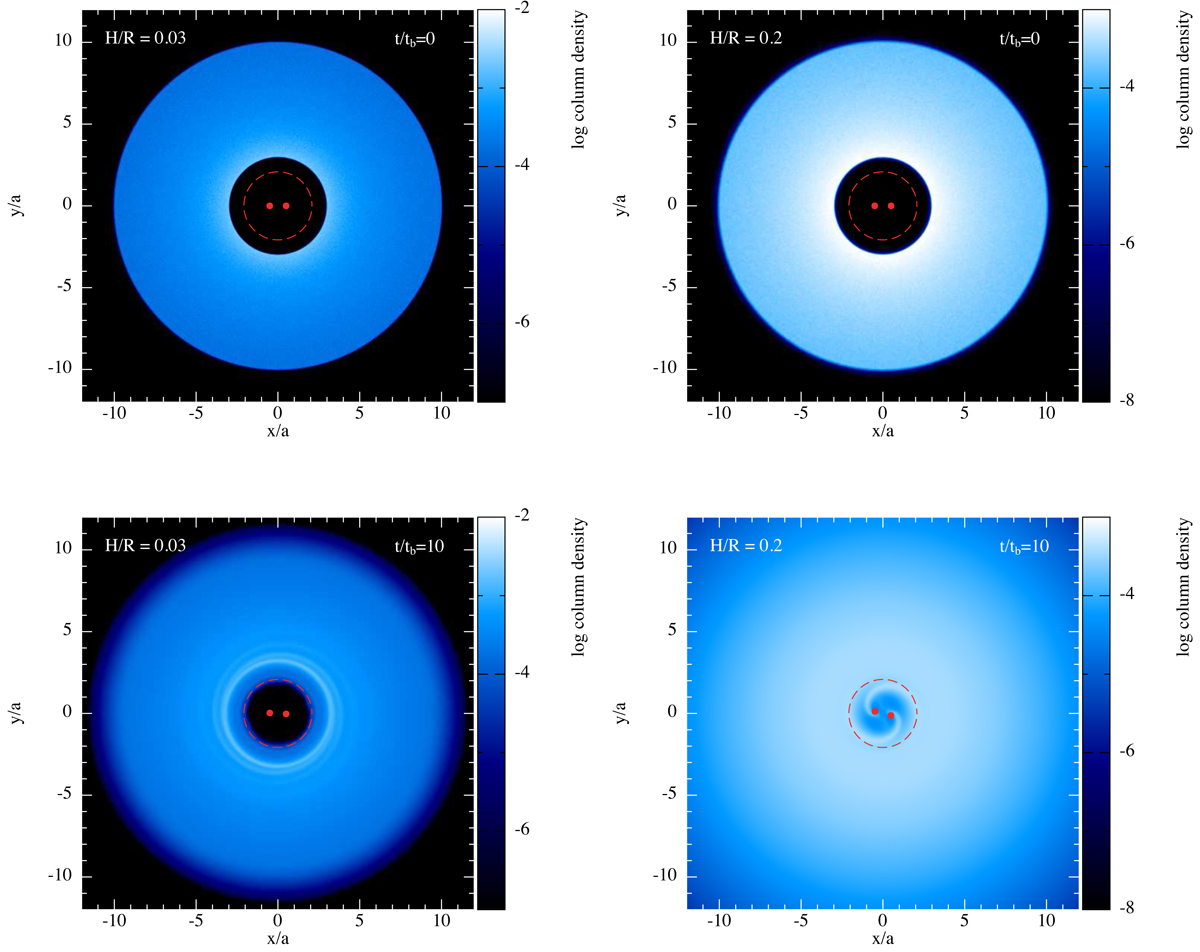
Column density plots for the thin (H/R = 0.03; left hand panels) and thick (H/R = 0.2; right hand panels) disc simulations. These images are made at times of 0tb (top row), 10tb (second row), 100tb (third row, overleaf) and 400tb (fourth row, overleaf), where ![]() is the initial orbital time of the binary. Note that as the binary is allowed to evolve in the simulations, the binary has actually executed a slightly larger (smaller) number of orbits in the thin (thick) disc case. The colour bar denotes the column density, and thus the view is of the x–y plane (i.e. the binary orbital plane) and the density has been integrated through all z. Note that the colour bars are the same for all of the thin disc panels and for all of the thick disc panels, but are different between the two simulations; this is because the two simulations show different evolution of the surface density, with the thin disc case producing increased surface density at the locations of strong disc resonances (the white regions at t = 100tb and t = 400tb) whereas the thick disc case shows a rapid decline in disc surface density due to significant accretion on to the binary and the disc expanding to larger radii. The disc morphology is distinct between the thick and thin disc cases. The thick disc quickly establishes a steady-state morphology comprising a smooth (accretion) disc for R ≳ 2a with two strong streams of material spiraling on to the binary at R ≲ 2a. As time proceeds this morphology persists and the surface density decays. For the thin disc a quasi-steady morphology takes longer to occur, with, on timescales t ≳ 100tb, a quasi-steady, eccentric, and precessing inner disc edge at R ≈ 2 − 3a is observed. This structure persists for the remainder of the simulation (to ≈1000tb). For circumbinary discs (see Artymowicz & Lubow 1994) the strongest resonance that is generally expected to be in the disc is given by the (m, l) = (2, 1) resonance (where m is the azimuthal number and l is the time-harmonic number), which occurs at a radius of 2.08a; this location is marked on each panel with a red dashed circle.
is the initial orbital time of the binary. Note that as the binary is allowed to evolve in the simulations, the binary has actually executed a slightly larger (smaller) number of orbits in the thin (thick) disc case. The colour bar denotes the column density, and thus the view is of the x–y plane (i.e. the binary orbital plane) and the density has been integrated through all z. Note that the colour bars are the same for all of the thin disc panels and for all of the thick disc panels, but are different between the two simulations; this is because the two simulations show different evolution of the surface density, with the thin disc case producing increased surface density at the locations of strong disc resonances (the white regions at t = 100tb and t = 400tb) whereas the thick disc case shows a rapid decline in disc surface density due to significant accretion on to the binary and the disc expanding to larger radii. The disc morphology is distinct between the thick and thin disc cases. The thick disc quickly establishes a steady-state morphology comprising a smooth (accretion) disc for R ≳ 2a with two strong streams of material spiraling on to the binary at R ≲ 2a. As time proceeds this morphology persists and the surface density decays. For the thin disc a quasi-steady morphology takes longer to occur, with, on timescales t ≳ 100tb, a quasi-steady, eccentric, and precessing inner disc edge at R ≈ 2 − 3a is observed. This structure persists for the remainder of the simulation (to ≈1000tb). For circumbinary discs (see Artymowicz & Lubow 1994) the strongest resonance that is generally expected to be in the disc is given by the (m, l) = (2, 1) resonance (where m is the azimuthal number and l is the time-harmonic number), which occurs at a radius of 2.08a; this location is marked on each panel with a red dashed circle.
Current usage metrics show cumulative count of Article Views (full-text article views including HTML views, PDF and ePub downloads, according to the available data) and Abstracts Views on Vision4Press platform.
Data correspond to usage on the plateform after 2015. The current usage metrics is available 48-96 hours after online publication and is updated daily on week days.
Initial download of the metrics may take a while.