Fig. 8.
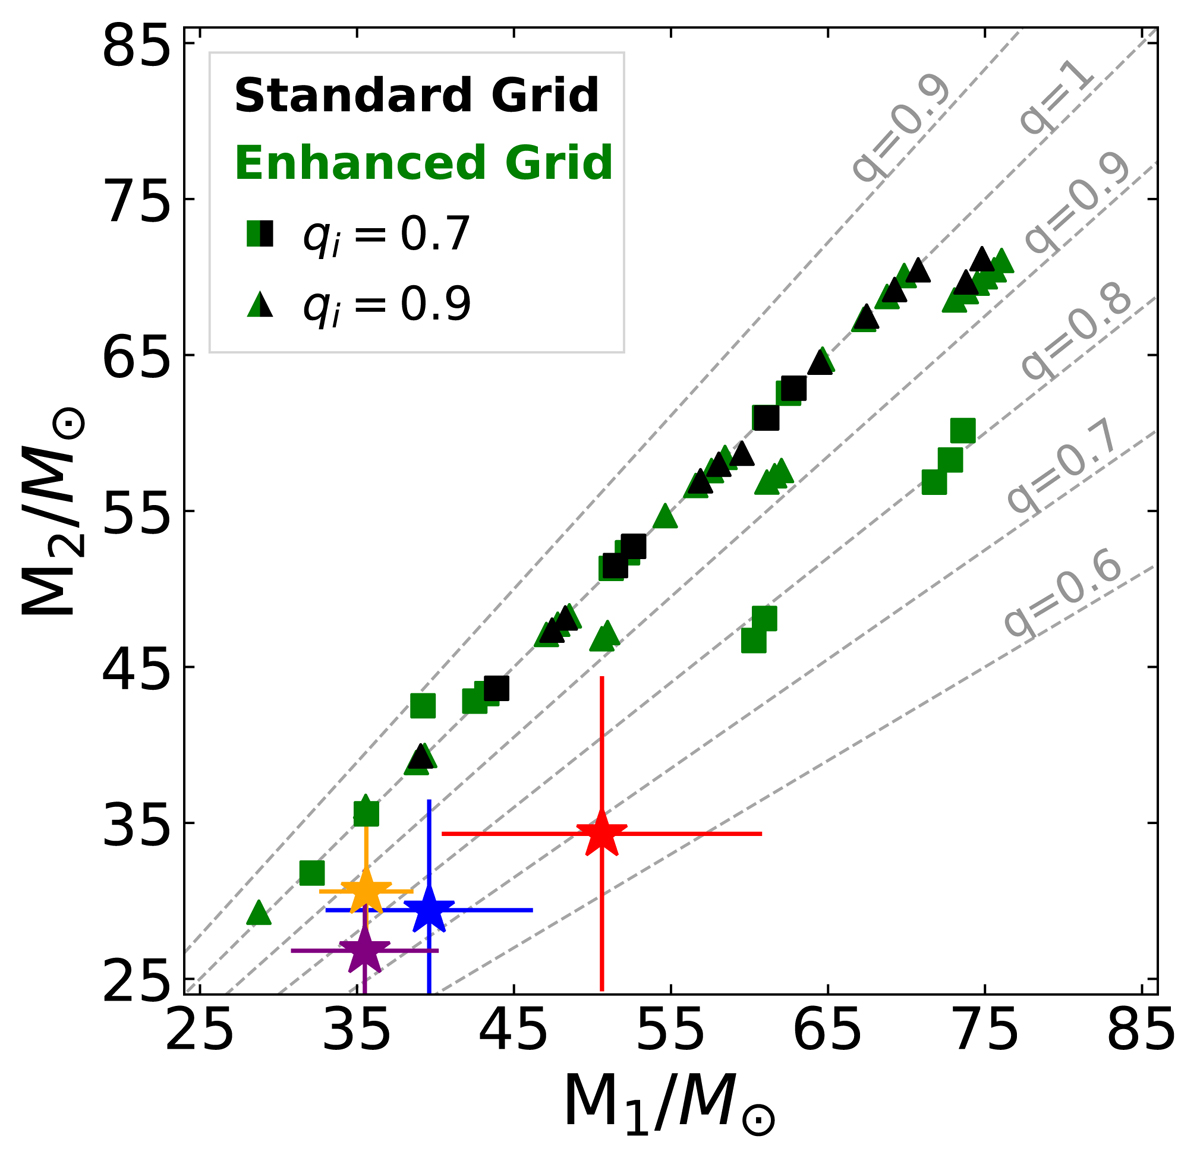
Masses of Star 1 (x-axis) and Star 2 (y-axis) at core helium depletion for systems with qi = 0.9, 0.7 (plotted as triangles and squares respectively). Models in the Standard Grid (without enhanced mixing) are marked in black, those in the Enhanced Grid (with enhanced mixing) in green. For clarity systems with qi = 1 are not plotted as they remain at their initial mass ratio. The grey dotted lines show various mass-ratios as marked. Red, blue, yellow and purple stars represent measured progenitor masses of gravitational wave events GW170729, GW170823, GW150914 and GW170818 respectively (Abbott et al. 2016; The LIGO Scientific Collaboration & The Virgo Collaboration 2019).
Current usage metrics show cumulative count of Article Views (full-text article views including HTML views, PDF and ePub downloads, according to the available data) and Abstracts Views on Vision4Press platform.
Data correspond to usage on the plateform after 2015. The current usage metrics is available 48-96 hours after online publication and is updated daily on week days.
Initial download of the metrics may take a while.