Fig. 7.
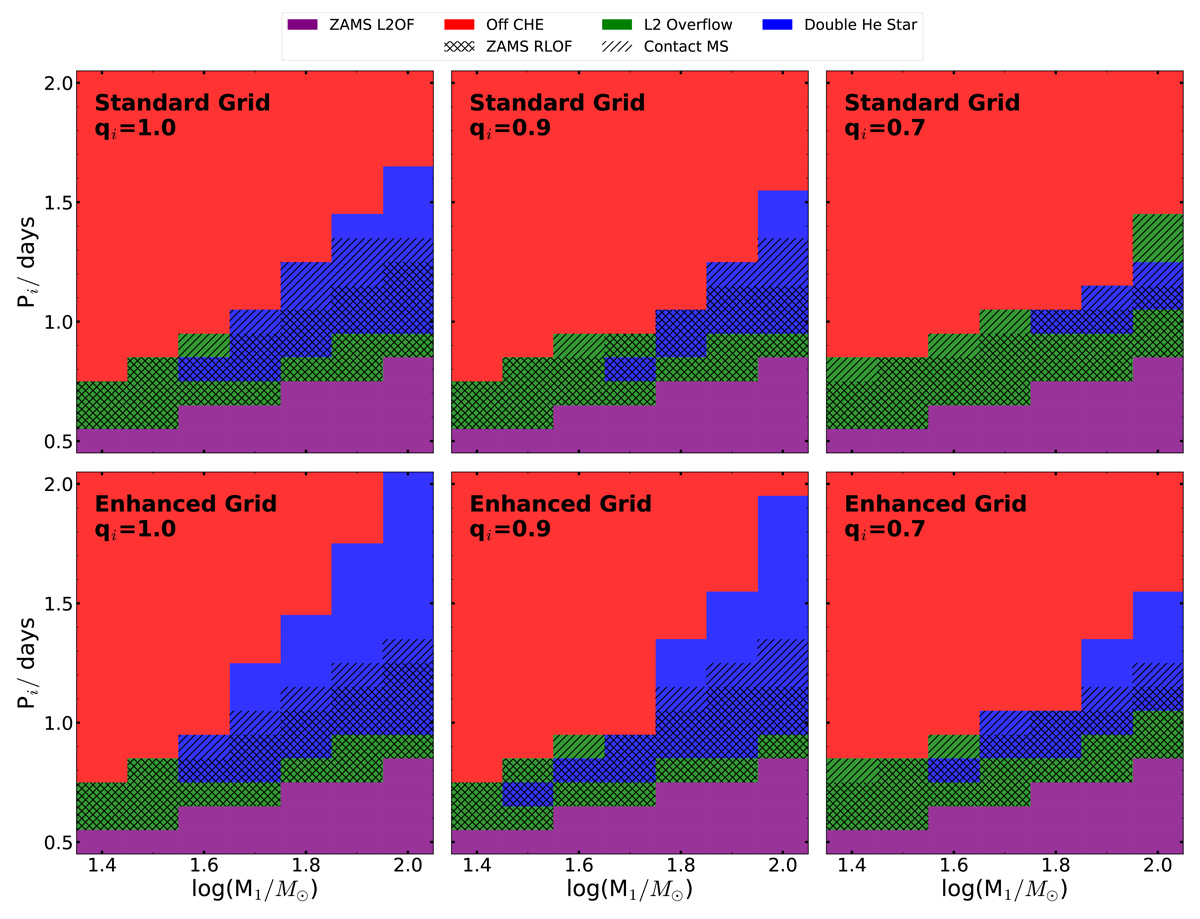
Final configurations of models in the Standard Grid (top row) and Enhanced Grid (bottom row) for initial mass ratios qi = 1.0, 0.9, 0.7. The colours indicate where overflow at the second Lagrangian point occurred at the zero-age-main-sequence or during evolution (purple and green respectively), where the difference between central and surface helium mass fraction exceeds 0.2 (red) and where homogeneous evolution occurs resulting in a double helium star (blue). Single hatched cells indicate that the system underwent contact on the main-sequence, and cross-hatched that contact occurred on the zero-age-main-sequence.
Current usage metrics show cumulative count of Article Views (full-text article views including HTML views, PDF and ePub downloads, according to the available data) and Abstracts Views on Vision4Press platform.
Data correspond to usage on the plateform after 2015. The current usage metrics is available 48-96 hours after online publication and is updated daily on week days.
Initial download of the metrics may take a while.