Fig. 5.
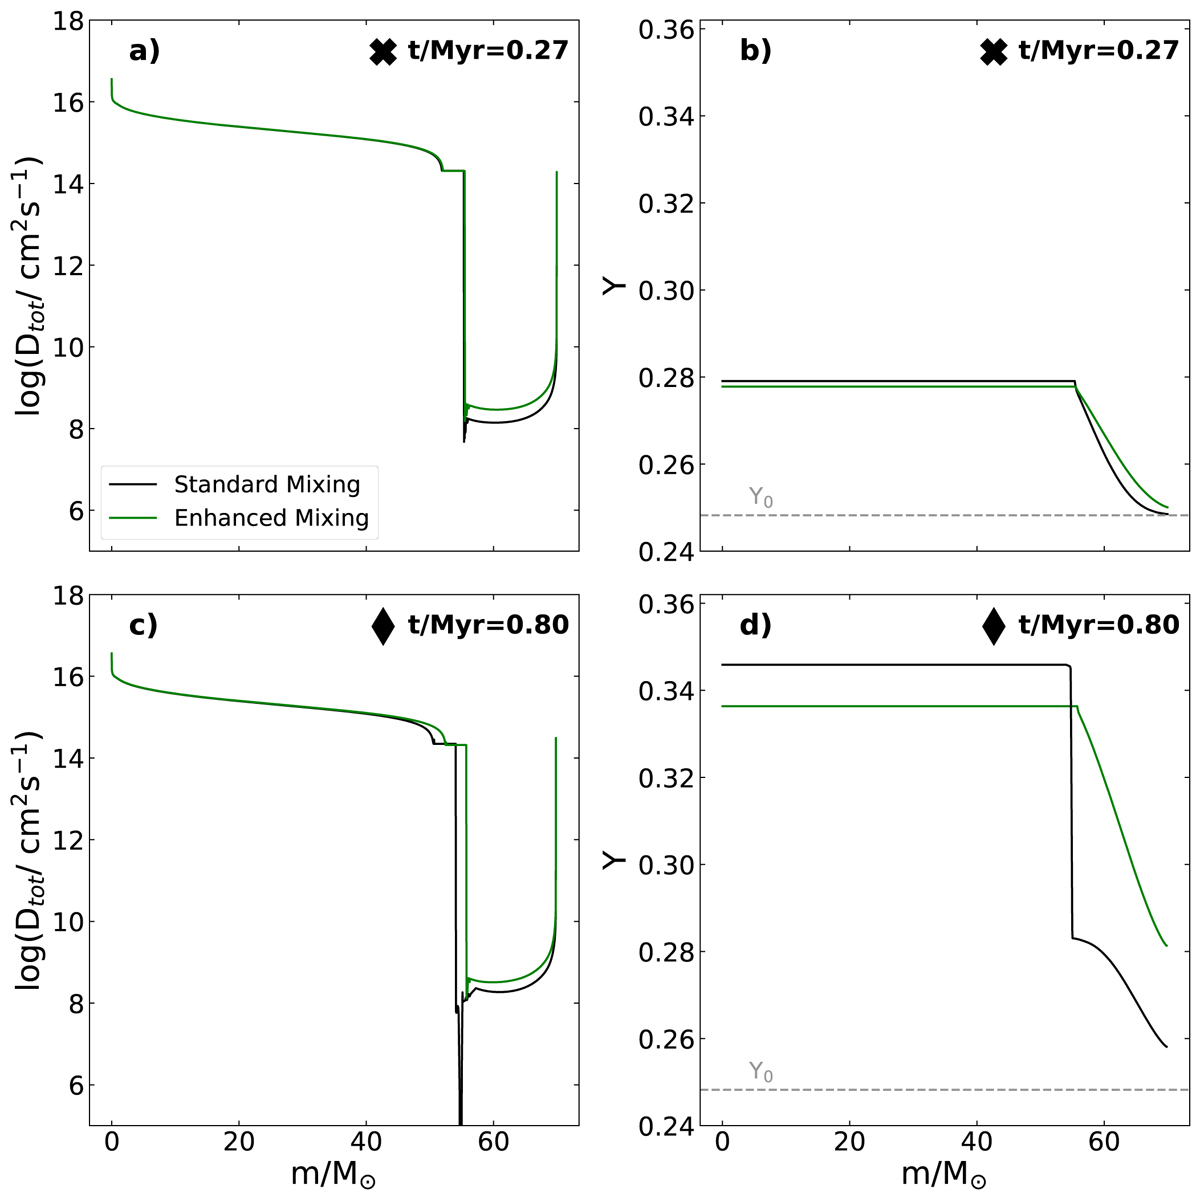
Internal profiles of Star 2 in the example system (M1 = 100 M⊙, qi = 0.7, Pi = 1.5 days) showing the total diffusion coefficient, Dtot (left panels), and helium mass fraction, Y (right panels), as a function of Lagrangian-mass-coordinate. The star in the Standard Grid is marked in green and that in the Enhanced Grid in black. Top panels: profiles at an age of 0.27 Myr, as marked by a cross in Fig. 4, bottom panels: age of 0.80 Myr, as marked by a diamond in Fig. 4. The grey dashed line in the right panels represents the initial helium mass fraction, Y0.
Current usage metrics show cumulative count of Article Views (full-text article views including HTML views, PDF and ePub downloads, according to the available data) and Abstracts Views on Vision4Press platform.
Data correspond to usage on the plateform after 2015. The current usage metrics is available 48-96 hours after online publication and is updated daily on week days.
Initial download of the metrics may take a while.