Fig. 4.
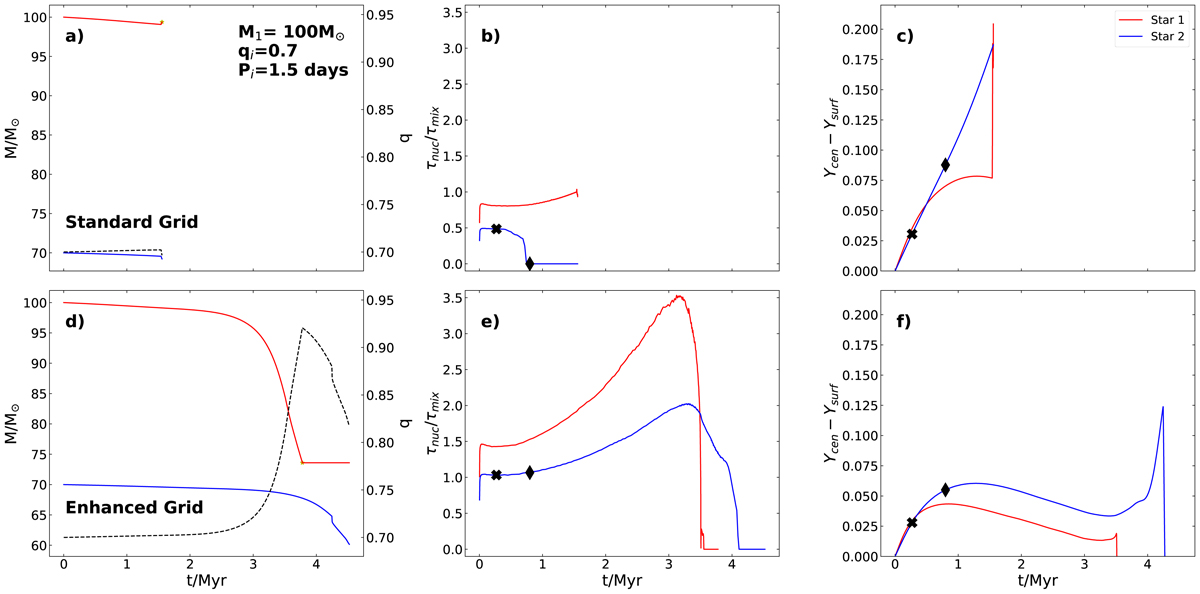
Diagnostic plots for a system with primary mass, M1 = 100 M⊙, initial mass-ratio, qi = 0.7, and initial orbital period 1.5 days. Top panels: system in the Standard Grid (without enhanced mixing) and bottom panels: system in the Enhanced Grid (with enhanced mixing). Left panels: evolution of each component’s mass and the mass ratio, q with a dotted line. Central panels: ratios of nuclear and mixing timescales as a function of time. Right panels: difference between central and surface helium mass fraction. Star 1 is plotted in red, Star 2 in blue. The black cross and diamond represent the times for which profiles of Star 2 are plotted in Fig. 5.
Current usage metrics show cumulative count of Article Views (full-text article views including HTML views, PDF and ePub downloads, according to the available data) and Abstracts Views on Vision4Press platform.
Data correspond to usage on the plateform after 2015. The current usage metrics is available 48-96 hours after online publication and is updated daily on week days.
Initial download of the metrics may take a while.