Fig. B.2.
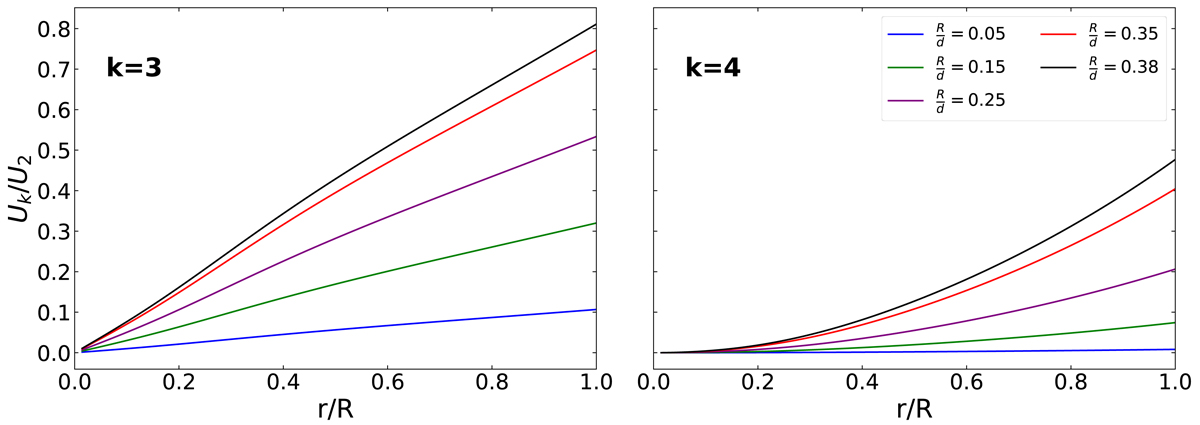
Functions U3 (left panel) and U4 (right panel) as fractions of U2 plotted as a function of normalised radius for the polytropic model in Fig. B.1. Various values of the stellar radius to orbital separation, R/d are plotted as coloured lines as given by the legend. R/d = 0.38 represents a contact system and is hence an upper limit.
Current usage metrics show cumulative count of Article Views (full-text article views including HTML views, PDF and ePub downloads, according to the available data) and Abstracts Views on Vision4Press platform.
Data correspond to usage on the plateform after 2015. The current usage metrics is available 48-96 hours after online publication and is updated daily on week days.
Initial download of the metrics may take a while.