Fig. 1.
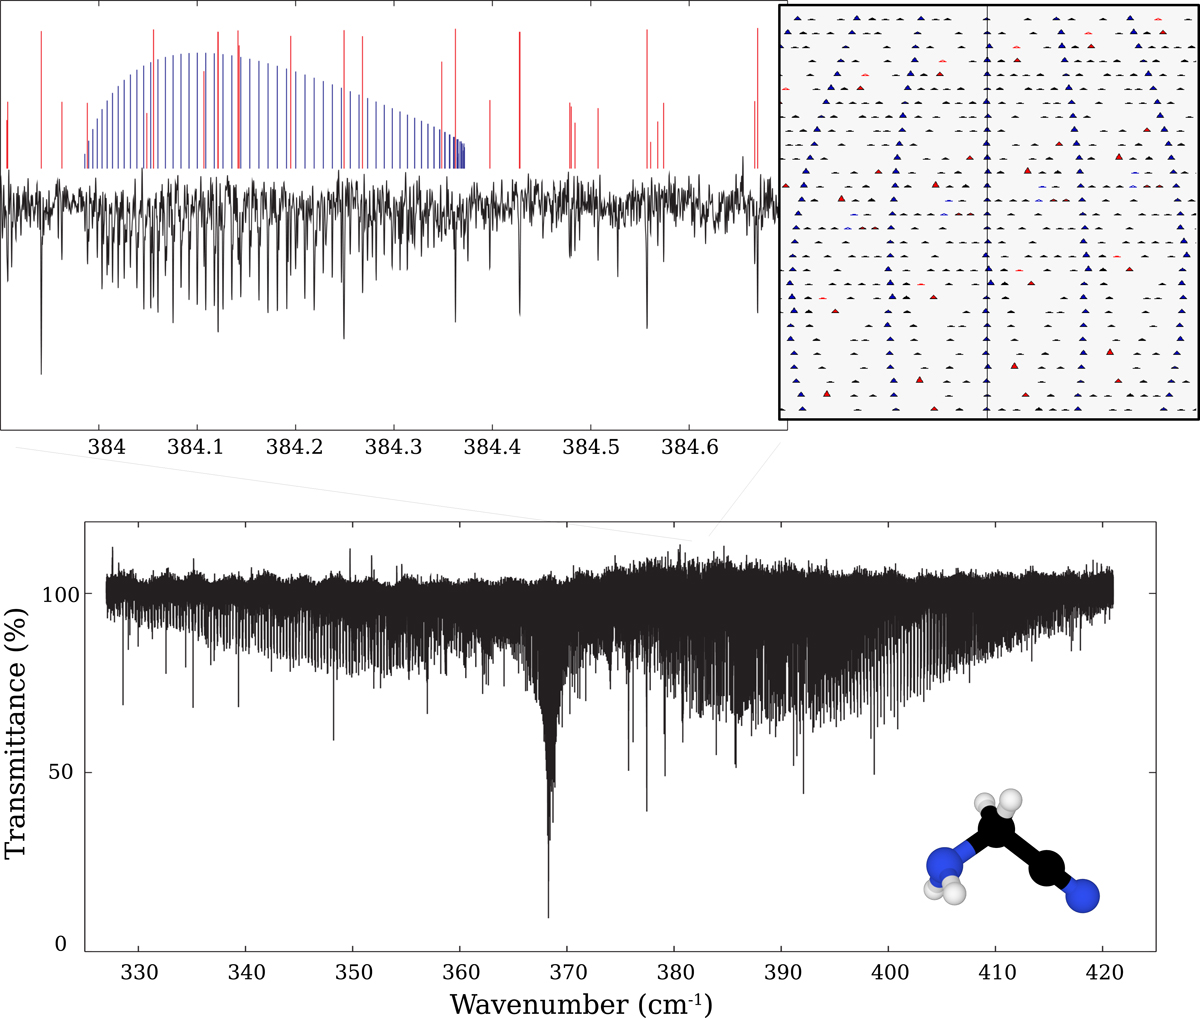
Bottom panel: overview of the ν17 band, centered around 368 cm−1, recorded at 3 μbar pressure. Residual water lines were blanked out from the spectrum. The molecular geometry of aminoacetonitrile is also shown with carbon in black, nitrogen in blue, and hydrogen in white. Top left panel: detail of the RQ9 branch. The black curve is the experimental spectrum. The blue lines represent the position and the intensity of the RQ9 components, while the red lines represent other RR transitions. Top right panel: Loomis-Wood diagram of the RQ9 branch using the same color legend. The wavenumber axis of the spectra (x) is plotted against consecutive J transitions across the y-axis; each row of the plot is 0.02 cm−1 wide. The height of the triangles is proportional to the spectral line intensity.
Current usage metrics show cumulative count of Article Views (full-text article views including HTML views, PDF and ePub downloads, according to the available data) and Abstracts Views on Vision4Press platform.
Data correspond to usage on the plateform after 2015. The current usage metrics is available 48-96 hours after online publication and is updated daily on week days.
Initial download of the metrics may take a while.