Fig. 4.
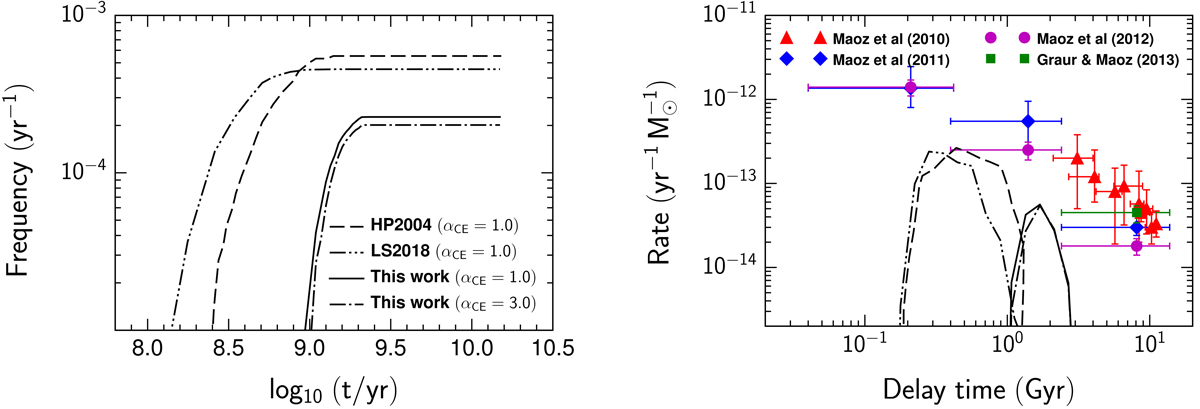
Left-hand panel: theoretical Galactic rates of SNe Ia as a function of delay time in our studied channel for a constant SFR of 5 M⊙ yr−1 with the CE ejection efficiency of αCE = 1.0 (dash-dotted line) and αCE = 3.0 (solid line). For a comparison, the results of Han & Podsiadlowski (2004, i.e. HP2004, see the dashed line) and Liu & Stancliffe (2018, i.e. LS2018, see the double-dotted line) are also shown in the figure. Right-hand panel: same as the left-hand panel but for the single starburst case of 1011 M⊙. Our measured DTD is compared to the observations (Maoz et al. 2010, 2011, 2012; Graur & Maoz 2013).
Current usage metrics show cumulative count of Article Views (full-text article views including HTML views, PDF and ePub downloads, according to the available data) and Abstracts Views on Vision4Press platform.
Data correspond to usage on the plateform after 2015. The current usage metrics is available 48-96 hours after online publication and is updated daily on week days.
Initial download of the metrics may take a while.