Fig. 8.
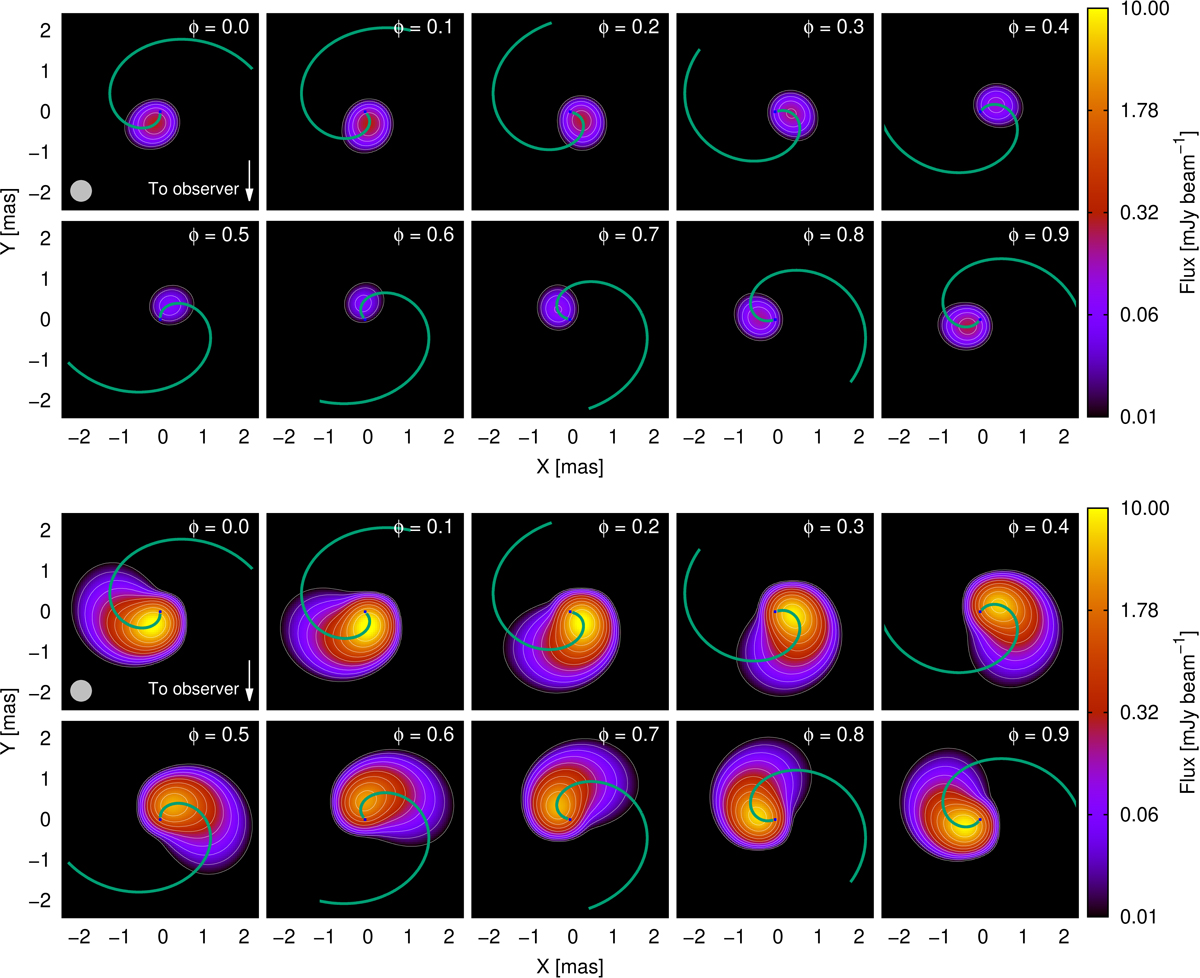
Simulated radio sky maps at 5 GHz for different orbital phases, vCor = 3 × 109 cm s−1, i = 30°, and ηB = 10−3 (top panel) and 10−1 (bottom panel). The assumed telescope beam is shown as a gray circle in the bottom left corner of the first plot. The contour lines start at a flux of 10 μJy beam−1 and increase with a factor of 2. The star is represented (to scale) with a blue circle at (0,0), and the solid green line shows the axis of the conical emitter, the onset of which points toward the observer for Φ = 0, and opposite to it for Φ = 0.5.
Current usage metrics show cumulative count of Article Views (full-text article views including HTML views, PDF and ePub downloads, according to the available data) and Abstracts Views on Vision4Press platform.
Data correspond to usage on the plateform after 2015. The current usage metrics is available 48-96 hours after online publication and is updated daily on week days.
Initial download of the metrics may take a while.