Fig. 6.
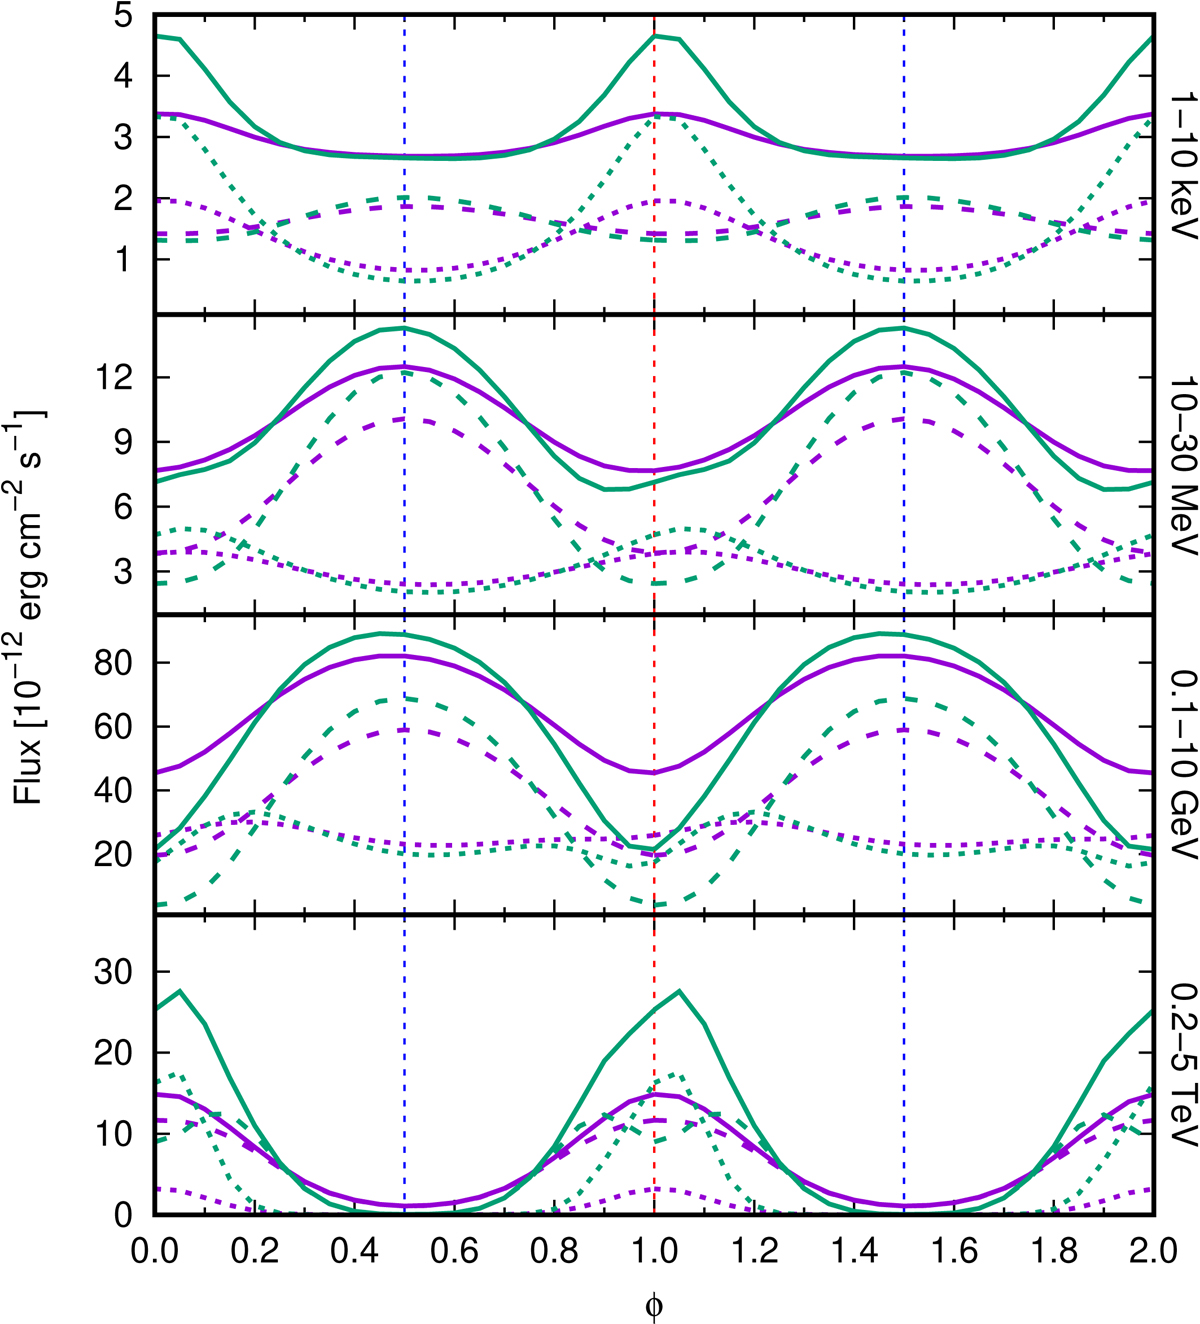
Light curves at different energy ranges (indicated in the right side) for ηB = 10−3, vCor = 3 × 109 cm s−1, and i = 30° (purple lines) and 60° (green lines). The contributions from the inner and outer regions are shown with dotted and dashed lines, respectively. The vertical dotted blue and red lines show the position of the superior and inferior conjunctions, respectively. Two orbits are represented for a better visualization.
Current usage metrics show cumulative count of Article Views (full-text article views including HTML views, PDF and ePub downloads, according to the available data) and Abstracts Views on Vision4Press platform.
Data correspond to usage on the plateform after 2015. The current usage metrics is available 48-96 hours after online publication and is updated daily on week days.
Initial download of the metrics may take a while.