Fig. 4.
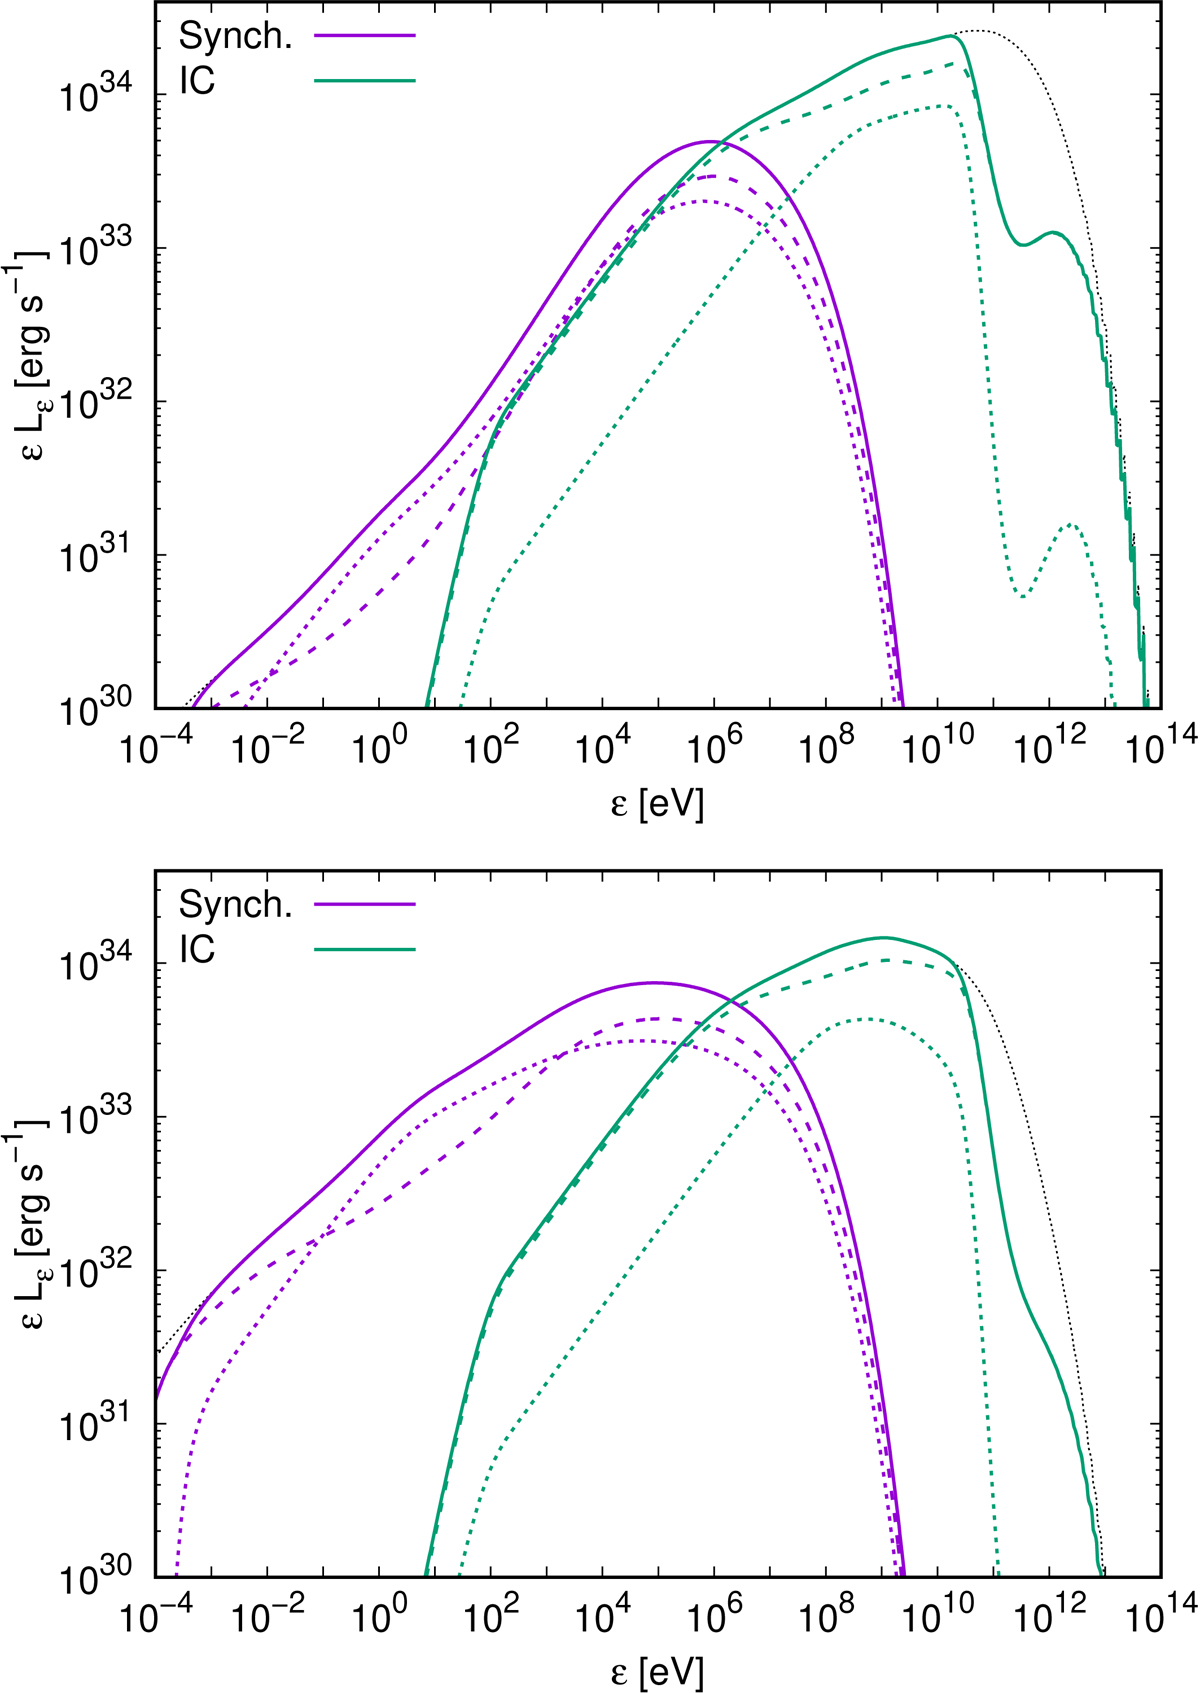
Observer synchrotron (purple lines) and IC (green lines) spectral energy distributions for Φ = 0.3, vCor = 3 × 109 cm s−1, i = 60°, and ηB = 10−3 (top panel) and 10−1 (bottom panel). The contributions of the inner and outer regions are represented with dotted and dashed lines, respectively. The black dotted lines show the total unabsorbed emission.
Current usage metrics show cumulative count of Article Views (full-text article views including HTML views, PDF and ePub downloads, according to the available data) and Abstracts Views on Vision4Press platform.
Data correspond to usage on the plateform after 2015. The current usage metrics is available 48-96 hours after online publication and is updated daily on week days.
Initial download of the metrics may take a while.