Fig. 11.
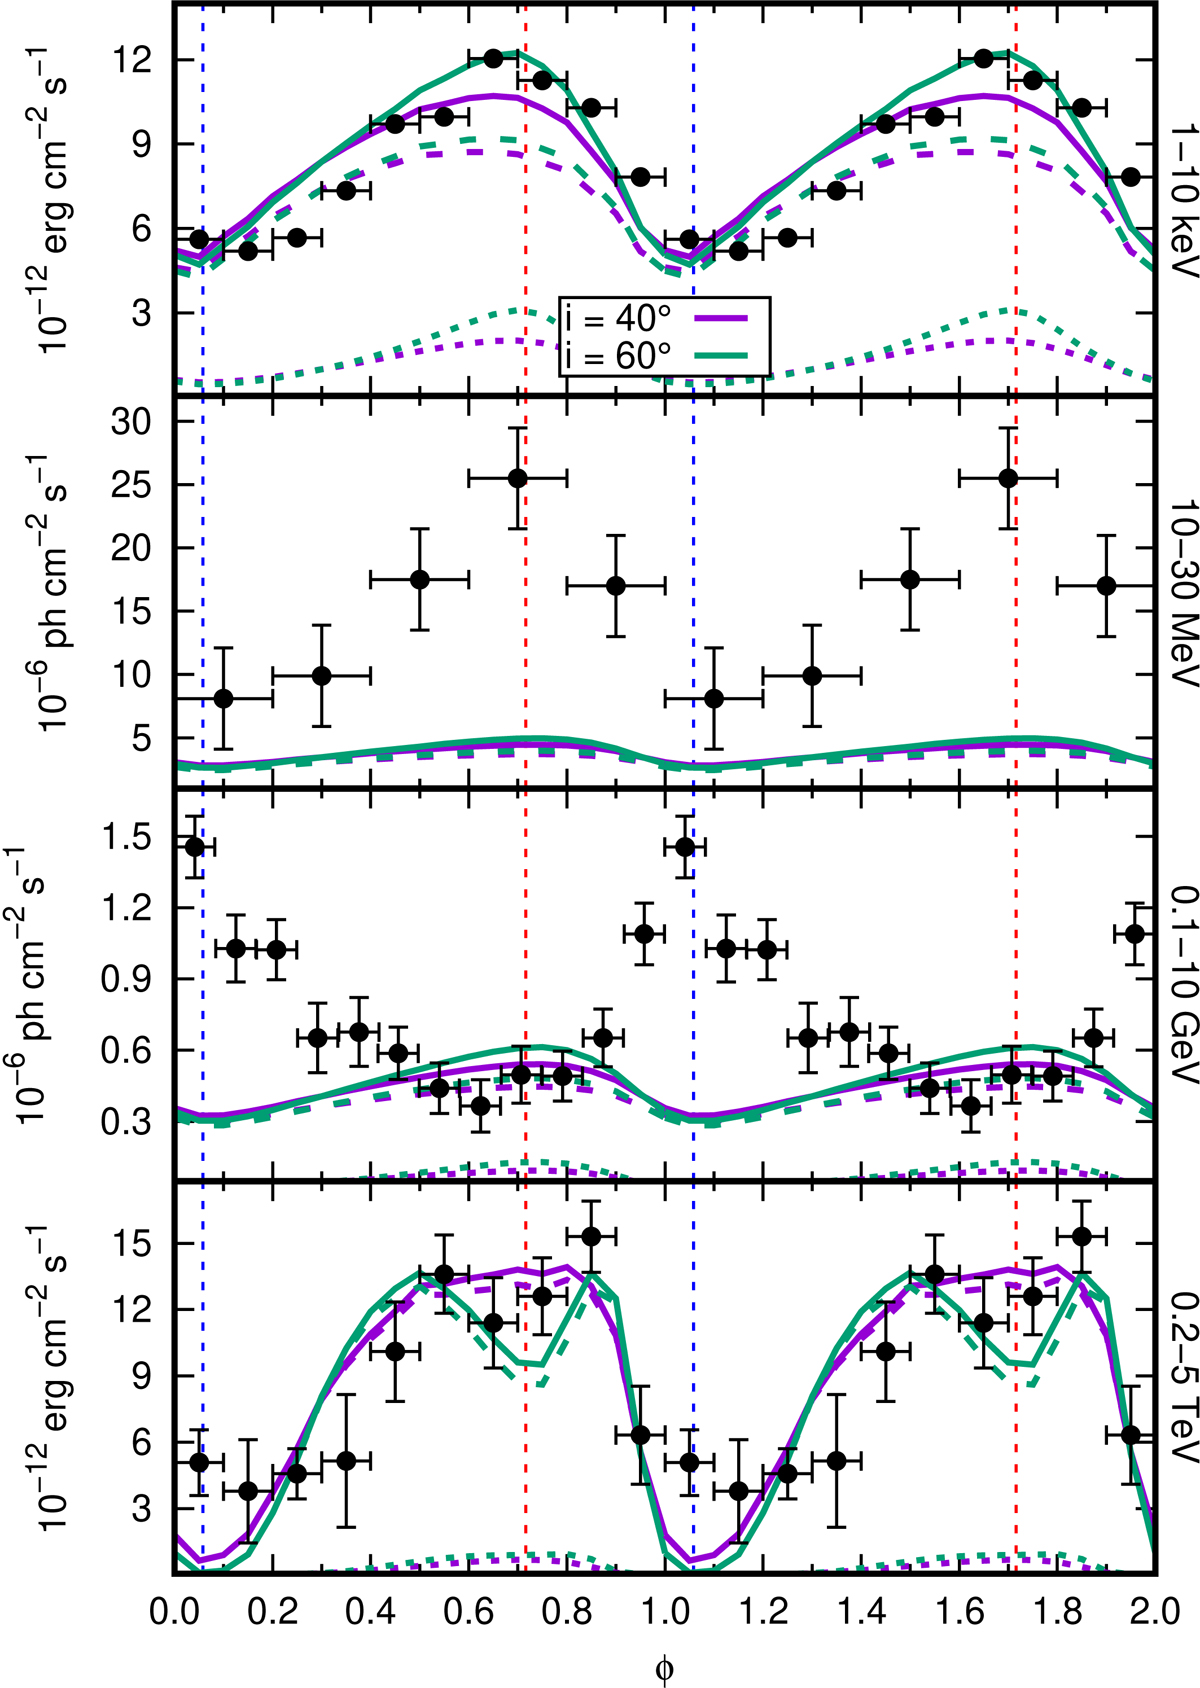
From top to bottom: light curves of LS 5039 in the Suzaku (1–10 keV), COMPTEL (10–30 MeV), Fermi/LAT (0.1–10 GeV), and H.E.S.S. (0.2–5 TeV) energy ranges, for i = 40° (purple lines) and 60° (green lines). The contributions of the inner and outer regions are shown with dotted and dashed lines, respectively. The phases corresponding to the INFC (SUPC) are shown with red (blue) vertical dashed lines. Flux units are not the same for all the plots.
Current usage metrics show cumulative count of Article Views (full-text article views including HTML views, PDF and ePub downloads, according to the available data) and Abstracts Views on Vision4Press platform.
Data correspond to usage on the plateform after 2015. The current usage metrics is available 48-96 hours after online publication and is updated daily on week days.
Initial download of the metrics may take a while.