Fig. 9
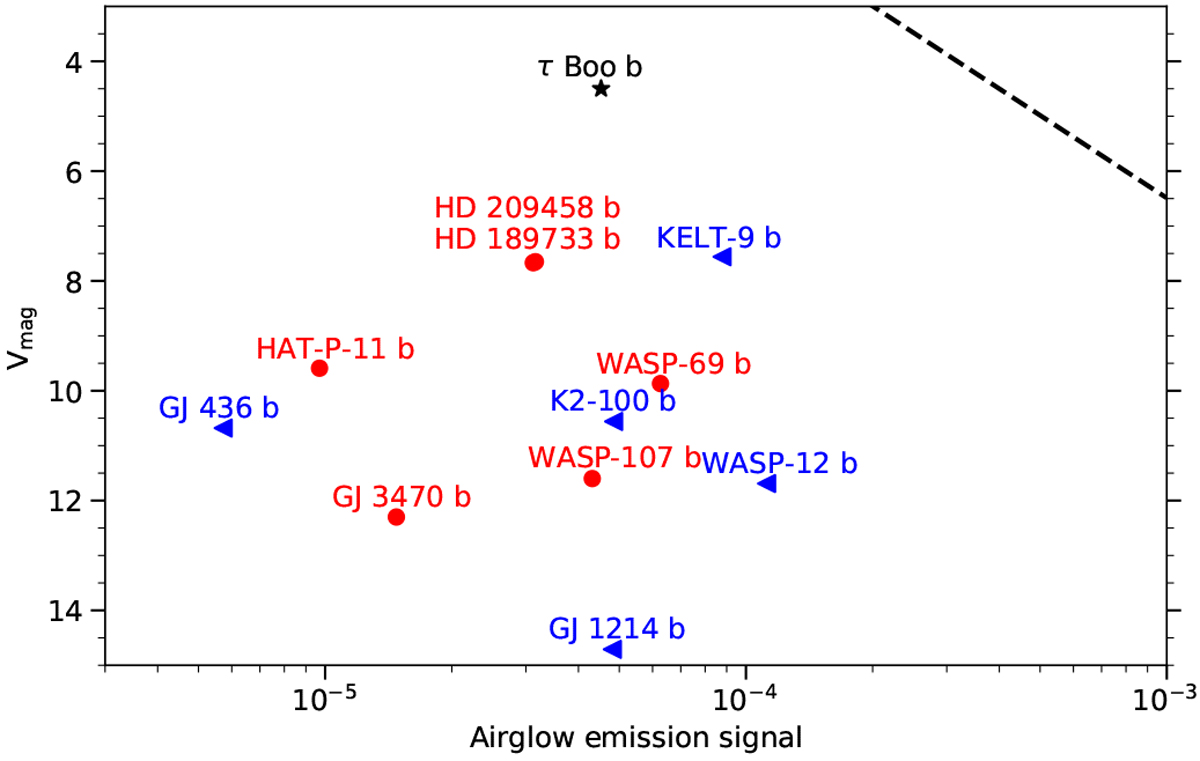
V magnitude of host stars plotted against the airglow emission signal estimated using Eq. (3) for exoplanets with He I absorption detections (red dots) or upper limits (blue triangles). The black star represents the estimated signal of τ Boo b assuming a typical absorption level of 1%. The dashed black line shows the detection limit of our analysis.
Current usage metrics show cumulative count of Article Views (full-text article views including HTML views, PDF and ePub downloads, according to the available data) and Abstracts Views on Vision4Press platform.
Data correspond to usage on the plateform after 2015. The current usage metrics is available 48-96 hours after online publication and is updated daily on week days.
Initial download of the metrics may take a while.