Fig. 7
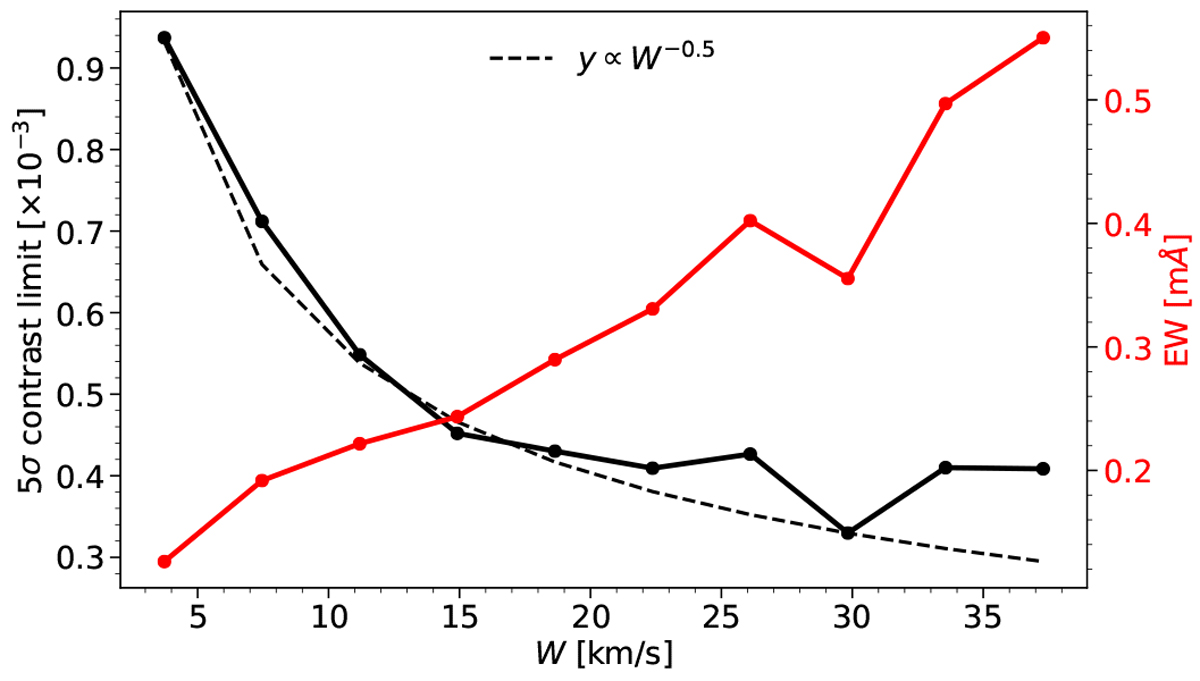
5σ detection limit of the He I airglow emission as a function of the line width of the potential signal using three nights of observationsof τ Boo b (solid black line), and corresponding equivalent widths of the detection limit (solid red curve). The dashed line represents the scaled relation of W−1∕2 that is expected for pure Gaussian white noise.
Current usage metrics show cumulative count of Article Views (full-text article views including HTML views, PDF and ePub downloads, according to the available data) and Abstracts Views on Vision4Press platform.
Data correspond to usage on the plateform after 2015. The current usage metrics is available 48-96 hours after online publication and is updated daily on week days.
Initial download of the metrics may take a while.