Fig. 6
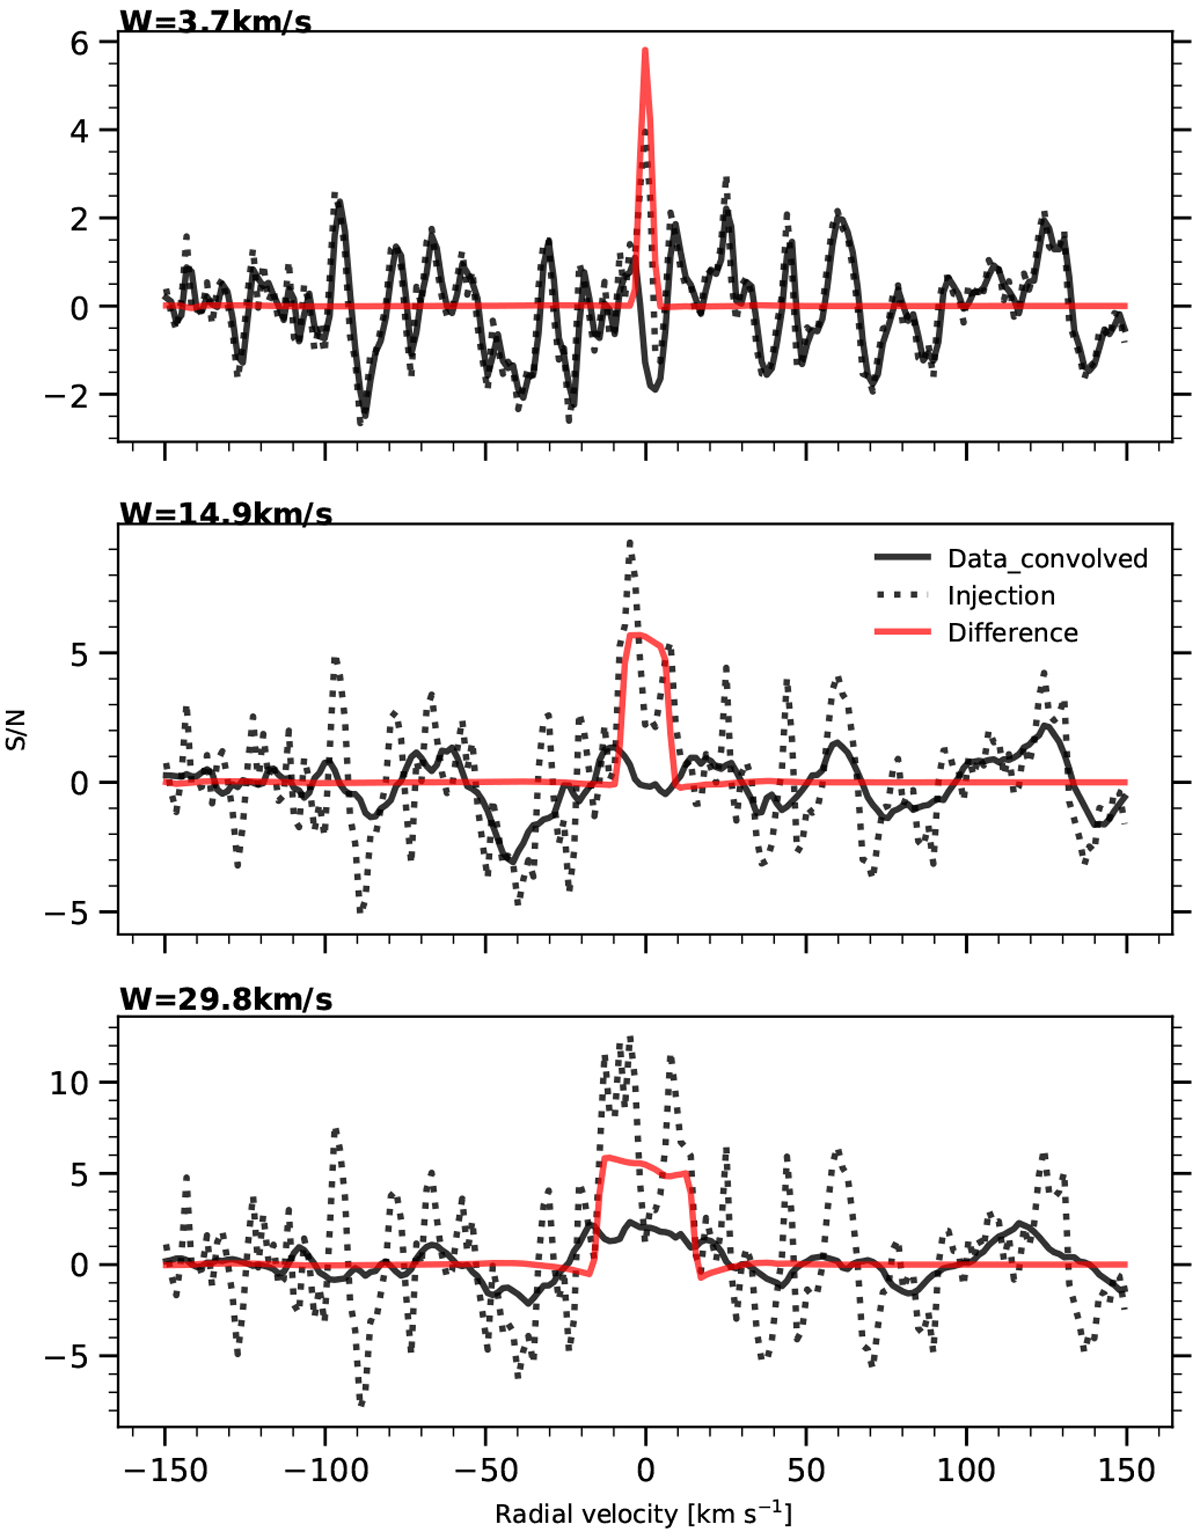
Combined (three nights) residual spectra in the planetary rest frame centered at the 10 830 Å He I line. In the three panels, the solid black line indicates the residual spectra, boxcar-smoothed by 3.7 km s−1 (top), 14.9 km s−1 (middle), and 29.8 km s−1 (bottom). The dotted curves show an artificially injected signal at an S/N of 5, and the solid red curve shows the difference between the injectedand original data. The values are scaled by the standard deviation of the observed residuals so that the y-axis represents the S/N.
Current usage metrics show cumulative count of Article Views (full-text article views including HTML views, PDF and ePub downloads, according to the available data) and Abstracts Views on Vision4Press platform.
Data correspond to usage on the plateform after 2015. The current usage metrics is available 48-96 hours after online publication and is updated daily on week days.
Initial download of the metrics may take a while.