Free Access
Fig. 5
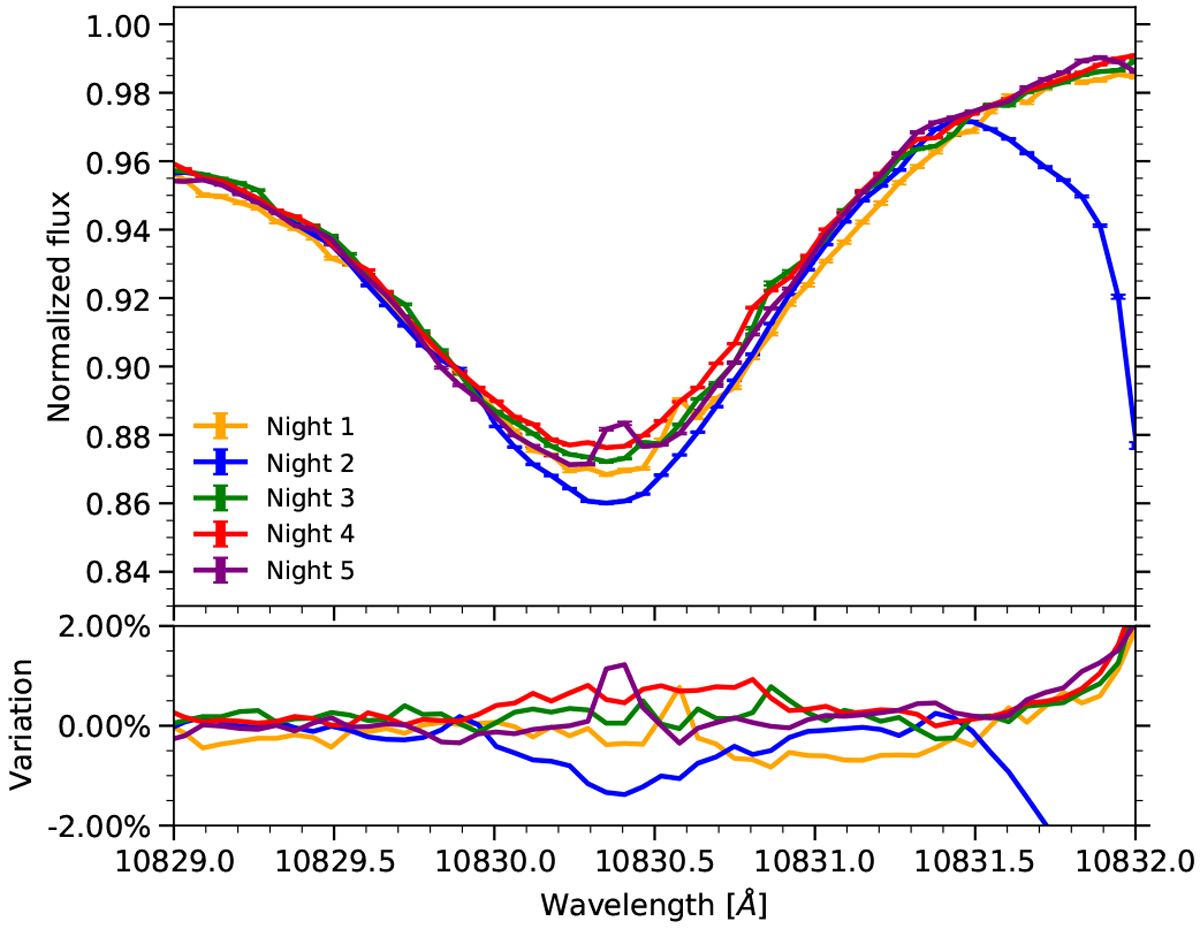
Upper panel: average profile of the stellar helium line in each night. Lower panel: difference of each profile with respect to the mean. The deep absorption line at 10 832.2 Å in night 2 (blue curve) is a telluric H2O line. The small peaks on top of the helium line in night 1 and 5 are caused by sky OH emission.
Current usage metrics show cumulative count of Article Views (full-text article views including HTML views, PDF and ePub downloads, according to the available data) and Abstracts Views on Vision4Press platform.
Data correspond to usage on the plateform after 2015. The current usage metrics is available 48-96 hours after online publication and is updated daily on week days.
Initial download of the metrics may take a while.