Fig. 4
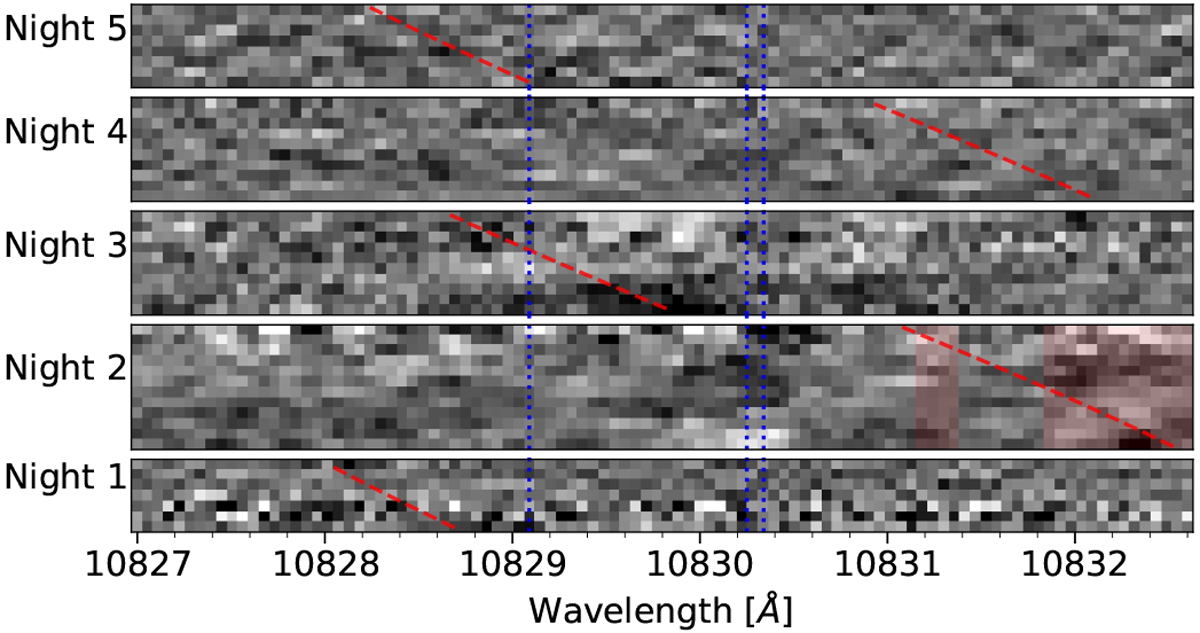
Residual spectral series from nights 1 to 5. The y-axis represents the time or orbital phase. The residuals are binned to 0.006 in phase for clarity. The slanted dashed lines in red trace the expected planetary helium line. The dotted lines in blue denote the positions of the stellar He I triplet. The shaded region in night 2 contains the telluric H2O absorption and OH emission line, which overlap the expected planetary helium line.
Current usage metrics show cumulative count of Article Views (full-text article views including HTML views, PDF and ePub downloads, according to the available data) and Abstracts Views on Vision4Press platform.
Data correspond to usage on the plateform after 2015. The current usage metrics is available 48-96 hours after online publication and is updated daily on week days.
Initial download of the metrics may take a while.