Fig. 3
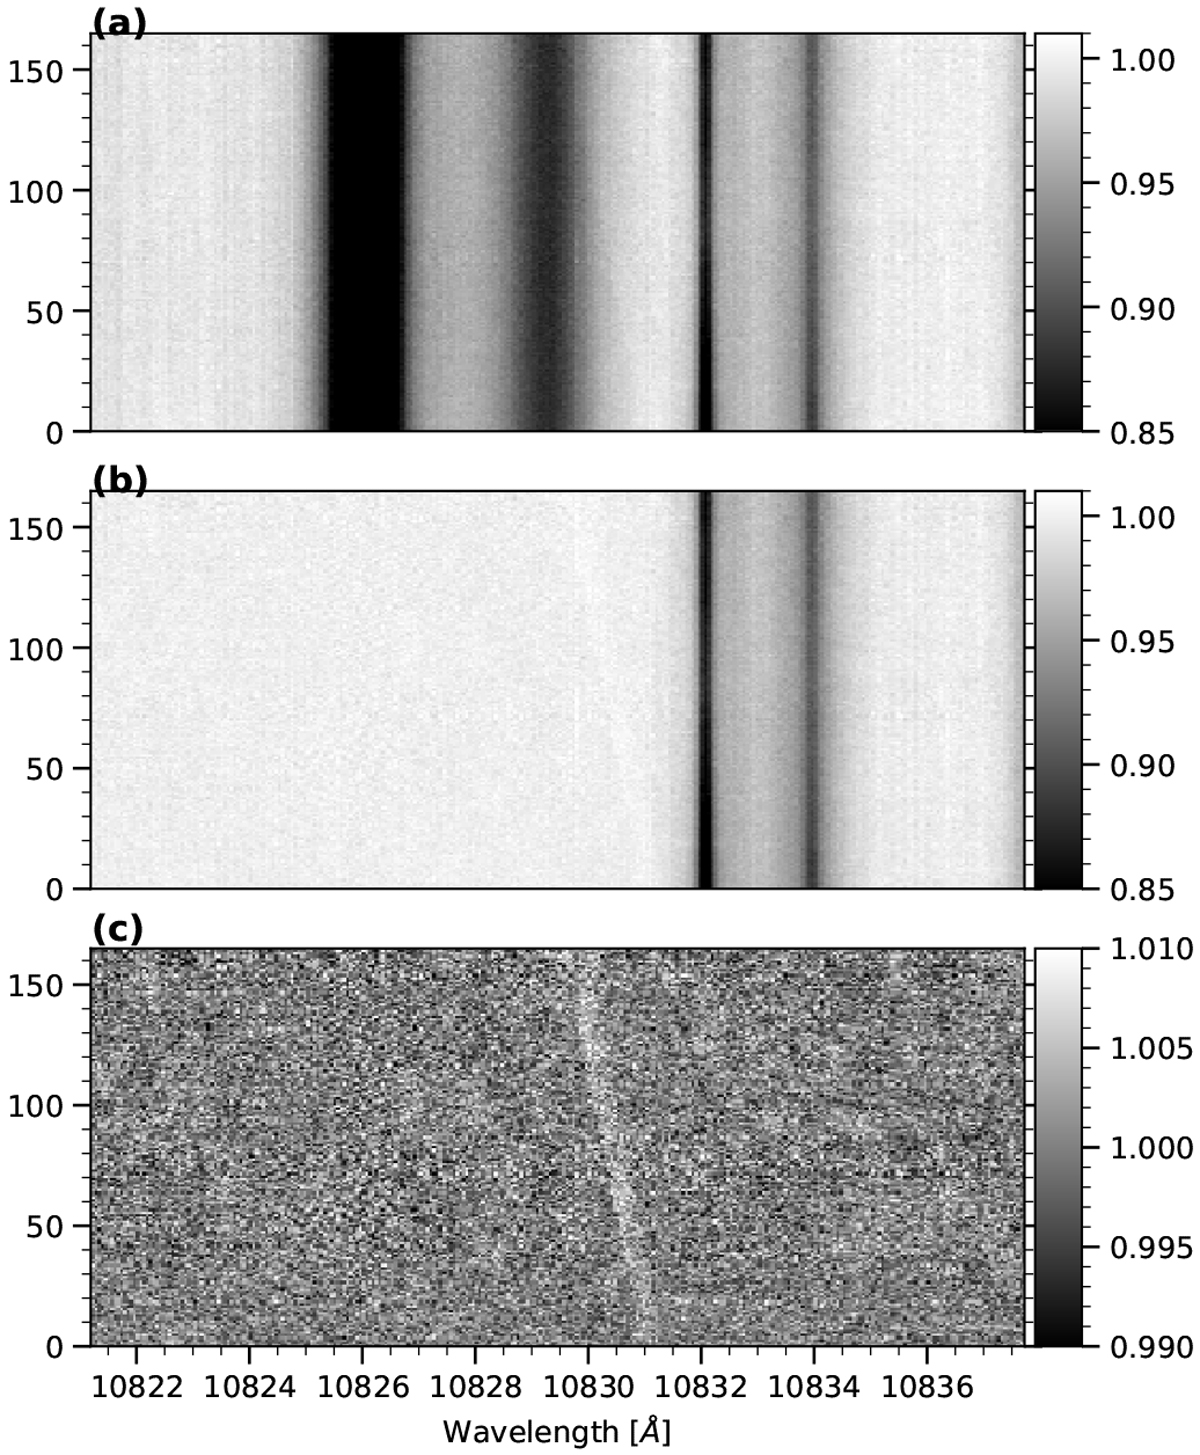
Illustration of the data reduction steps we applied to the spectral series taken on night 4. Each row in the matrix represents one spectrum, and the y-axis corresponds to time. As detailed in Sect. 4.1, the steps include (a) normalization of the continuum, (b) correction for stellar lines in each spectrum using an empirical model, and (c) removal of telluric contamination by correcting the temporal variation of the flux in telluric lines using a column-by-column linear regression. The trail of an artificially injected planetary helium line (with a magnitude of 0.3% and a width of 11 km s−1) is visible as a slanted white band near 10 830 Å that shifts in time as a result of the change in the radial component of the orbital velocity of the planet.
Current usage metrics show cumulative count of Article Views (full-text article views including HTML views, PDF and ePub downloads, according to the available data) and Abstracts Views on Vision4Press platform.
Data correspond to usage on the plateform after 2015. The current usage metrics is available 48-96 hours after online publication and is updated daily on week days.
Initial download of the metrics may take a while.