Fig. 5
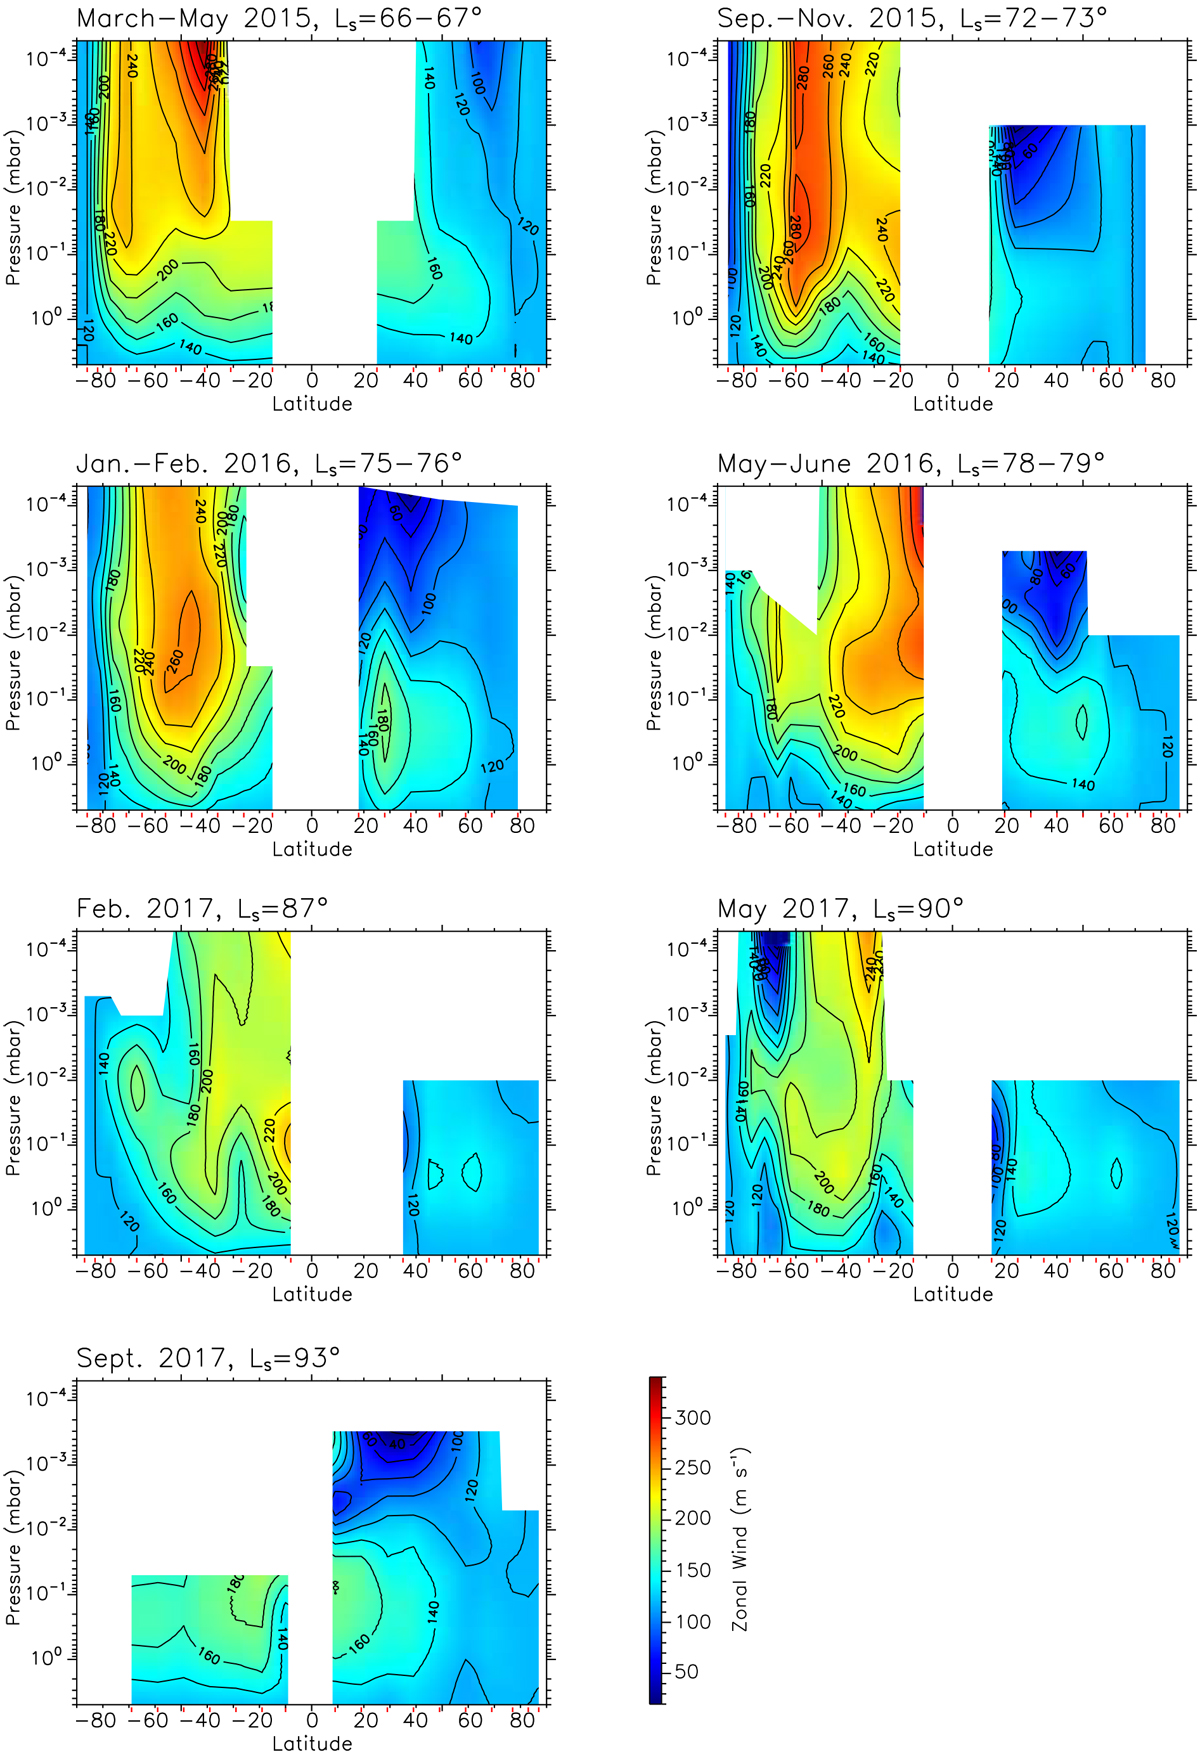
Zonal wind cross sections from March 2015 to September 2017. Contours are given every 20 m s−1 ; the color scale is the same for all plots. Regions without information are represented in white. They correspond to missing data, pressure levels not probed by nadir observations, or regions not used to perform the wind calculation at low latitudes.
Current usage metrics show cumulative count of Article Views (full-text article views including HTML views, PDF and ePub downloads, according to the available data) and Abstracts Views on Vision4Press platform.
Data correspond to usage on the plateform after 2015. The current usage metrics is available 48-96 hours after online publication and is updated daily on week days.
Initial download of the metrics may take a while.