Fig. 1
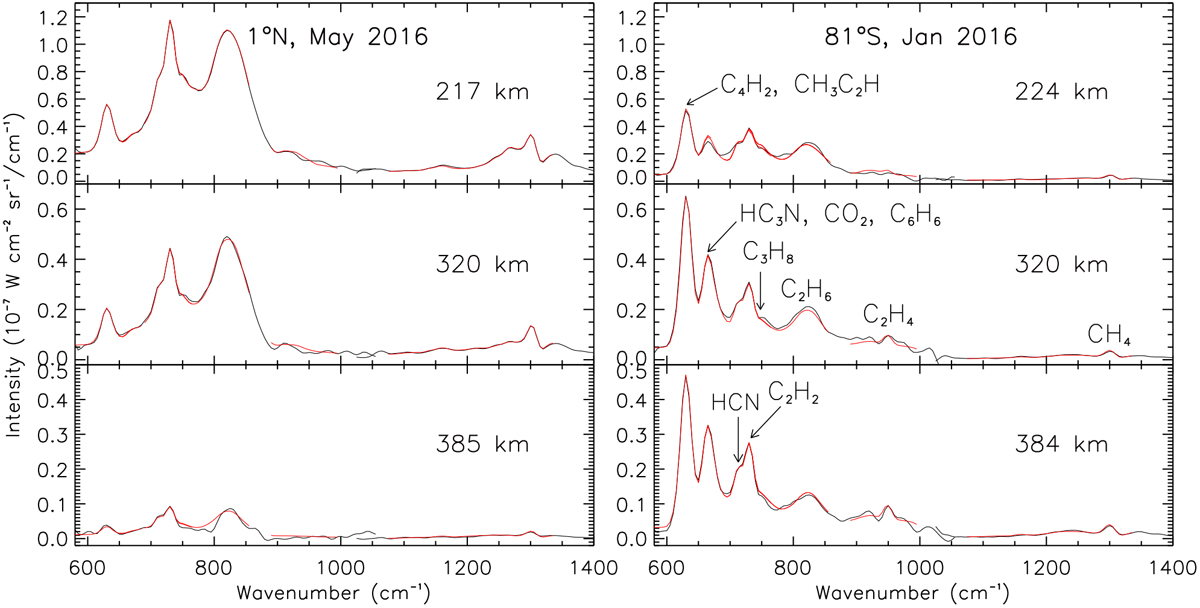
Example of CIRS limb spectra acquired at 1°N in July 2016 (left panel, black line) and 81°S in January 2016 (right panel, black line) at three different tangent heights. They are compared with the best fit spectra (in red). These spectra can be compared with those of Fig. 1 of Mathé et al. (2020, their Figs. 1 and2) acquired at similar location, altitude, and date at higher spectral resolution. The band centered at 630 cm−1 includes C4H2 and CH3C2H emission; the band centered at 673 cm−1 includes HC3N, CO2, and C6H6. HCN, C2H2, and C3H8 emission bands are centered respectively at 713, 730, and 748 cm−1. C2H6, C2H4, and CH4 bands are centered at 815, 950, and 1300 cm−1, respectively. An overlap between FP3 and FP4 spectra occurs in the 1000–1050 cm−1 spectral range.
Current usage metrics show cumulative count of Article Views (full-text article views including HTML views, PDF and ePub downloads, according to the available data) and Abstracts Views on Vision4Press platform.
Data correspond to usage on the plateform after 2015. The current usage metrics is available 48-96 hours after online publication and is updated daily on week days.
Initial download of the metrics may take a while.