Free Access
Fig. 7.
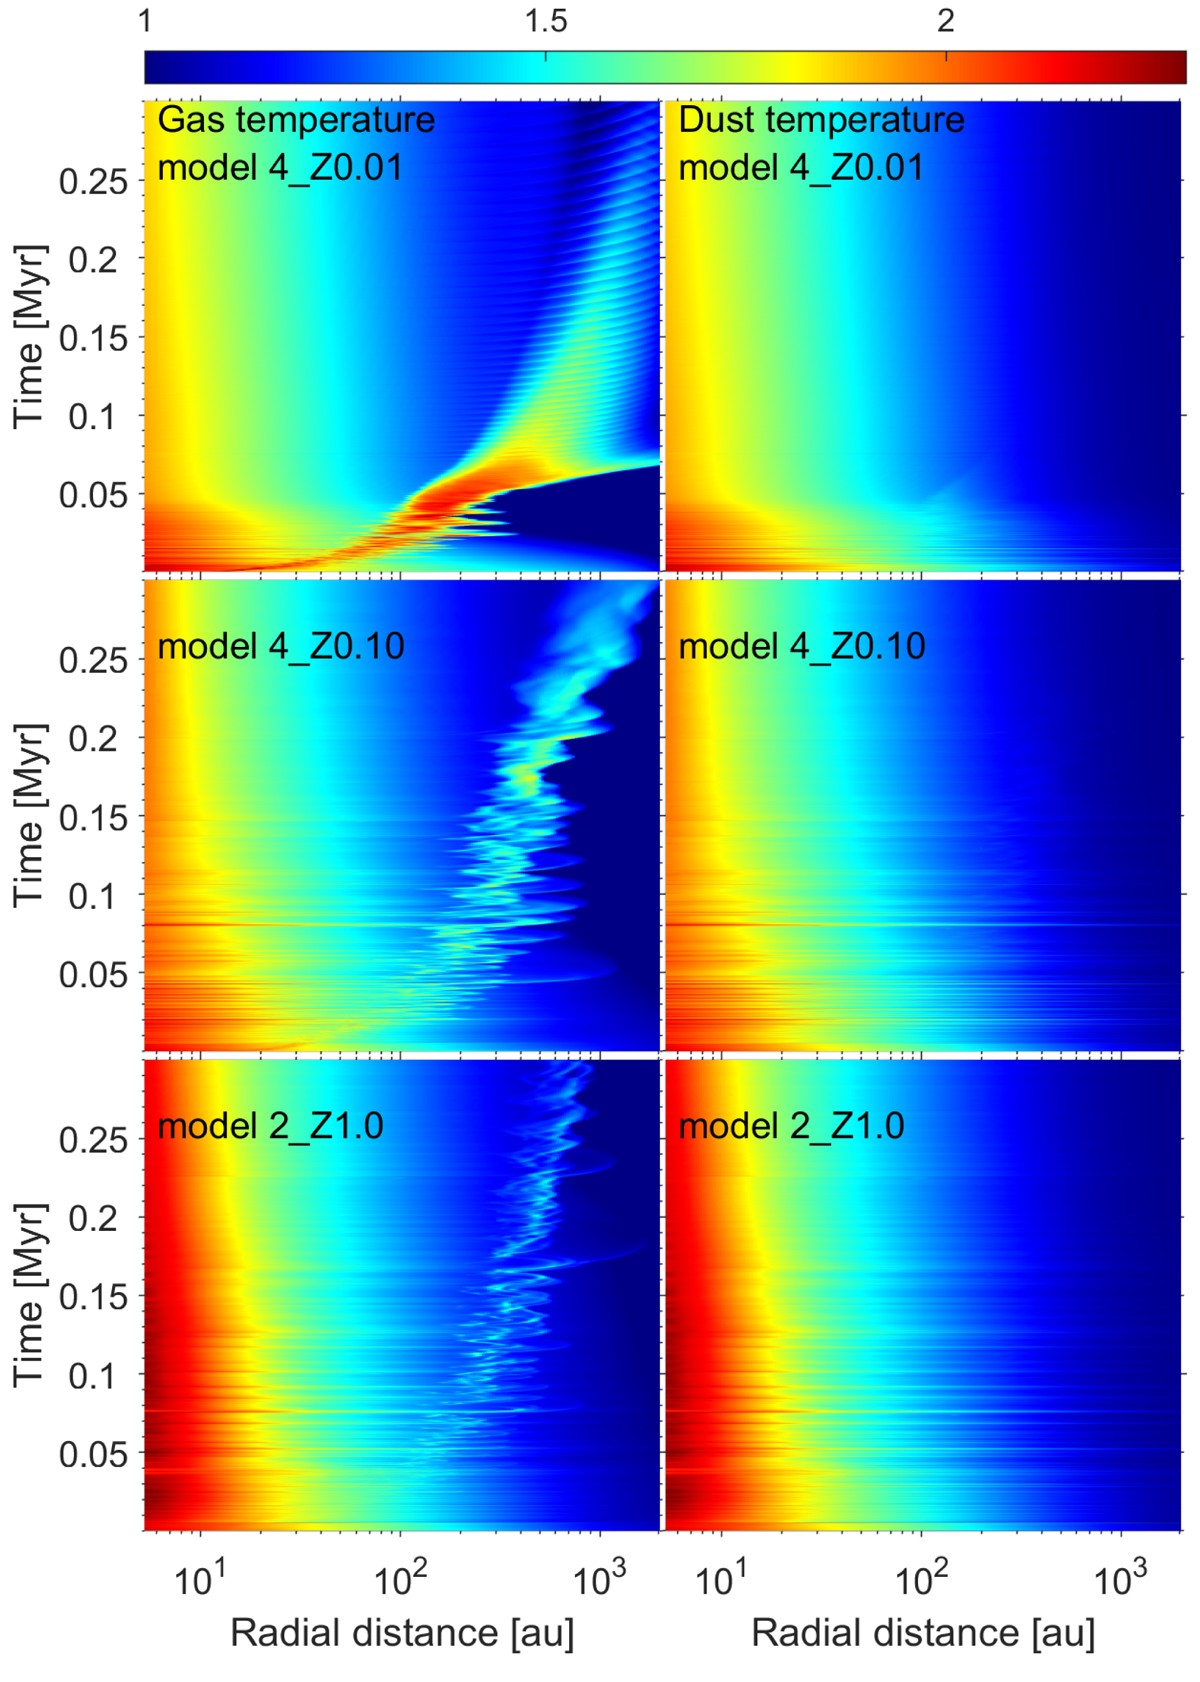
Spacetime diagrams of the gas temperature (left column) and dust temperature (right column) in models with different metallicities, as indicated in each panel. The color bar is in units of Kelvin on the log scale. The time is counted from the disk formation instance.
Current usage metrics show cumulative count of Article Views (full-text article views including HTML views, PDF and ePub downloads, according to the available data) and Abstracts Views on Vision4Press platform.
Data correspond to usage on the plateform after 2015. The current usage metrics is available 48-96 hours after online publication and is updated daily on week days.
Initial download of the metrics may take a while.