Free Access
Fig. 4.
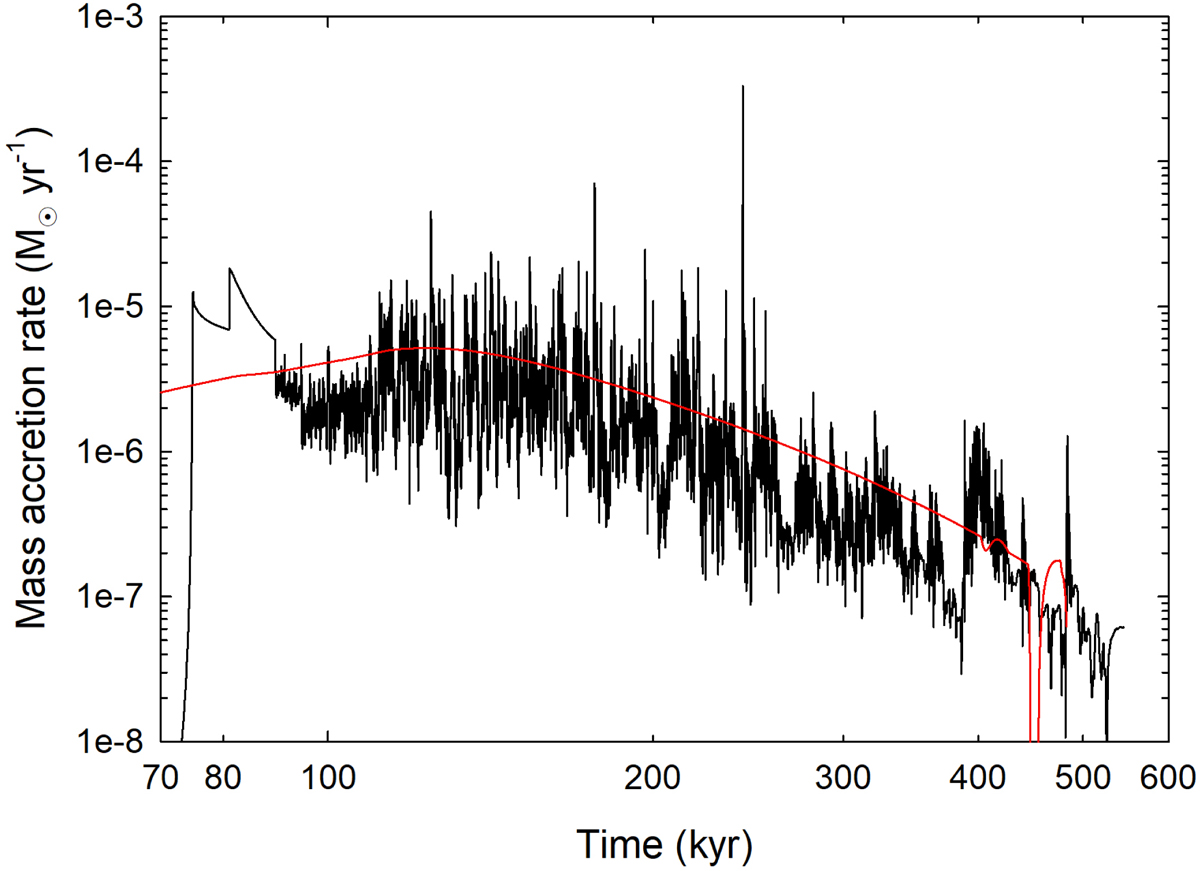
Mass accretion rate vs. time in model 1_Z1.0 shown with the black line. The red line presents the mass infall rate on the disk. The time is counted from the onset of gravitational collapse and is shown on the log scale to better resolve the variability at early times. The disk forms at 89 kyr.
Current usage metrics show cumulative count of Article Views (full-text article views including HTML views, PDF and ePub downloads, according to the available data) and Abstracts Views on Vision4Press platform.
Data correspond to usage on the plateform after 2015. The current usage metrics is available 48-96 hours after online publication and is updated daily on week days.
Initial download of the metrics may take a while.