Fig. 1.
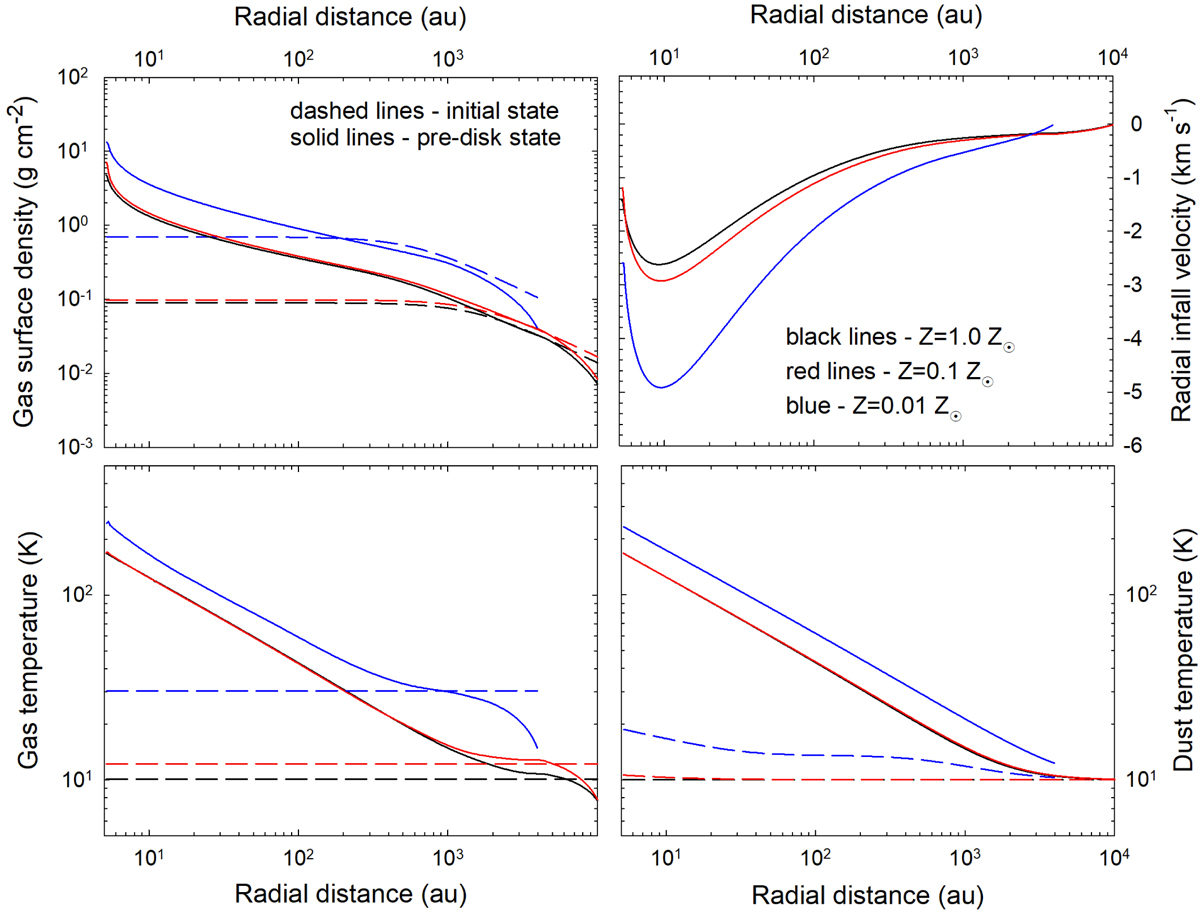
Radial profiles of the gas surface density (top left), radial infall velocity (top right), gas temperature (bottom left), and dust temperature (bottom right) in model Z1.0. The dashed curves correspond to the initial setup at the onset of gravitational collapse, while the solid curves show the quantities at the time instance immediately preceding disk formation. Curves of different color correspond to models with different metallicities, as shown in the legend.
Current usage metrics show cumulative count of Article Views (full-text article views including HTML views, PDF and ePub downloads, according to the available data) and Abstracts Views on Vision4Press platform.
Data correspond to usage on the plateform after 2015. The current usage metrics is available 48-96 hours after online publication and is updated daily on week days.
Initial download of the metrics may take a while.