Free Access
Fig. 7
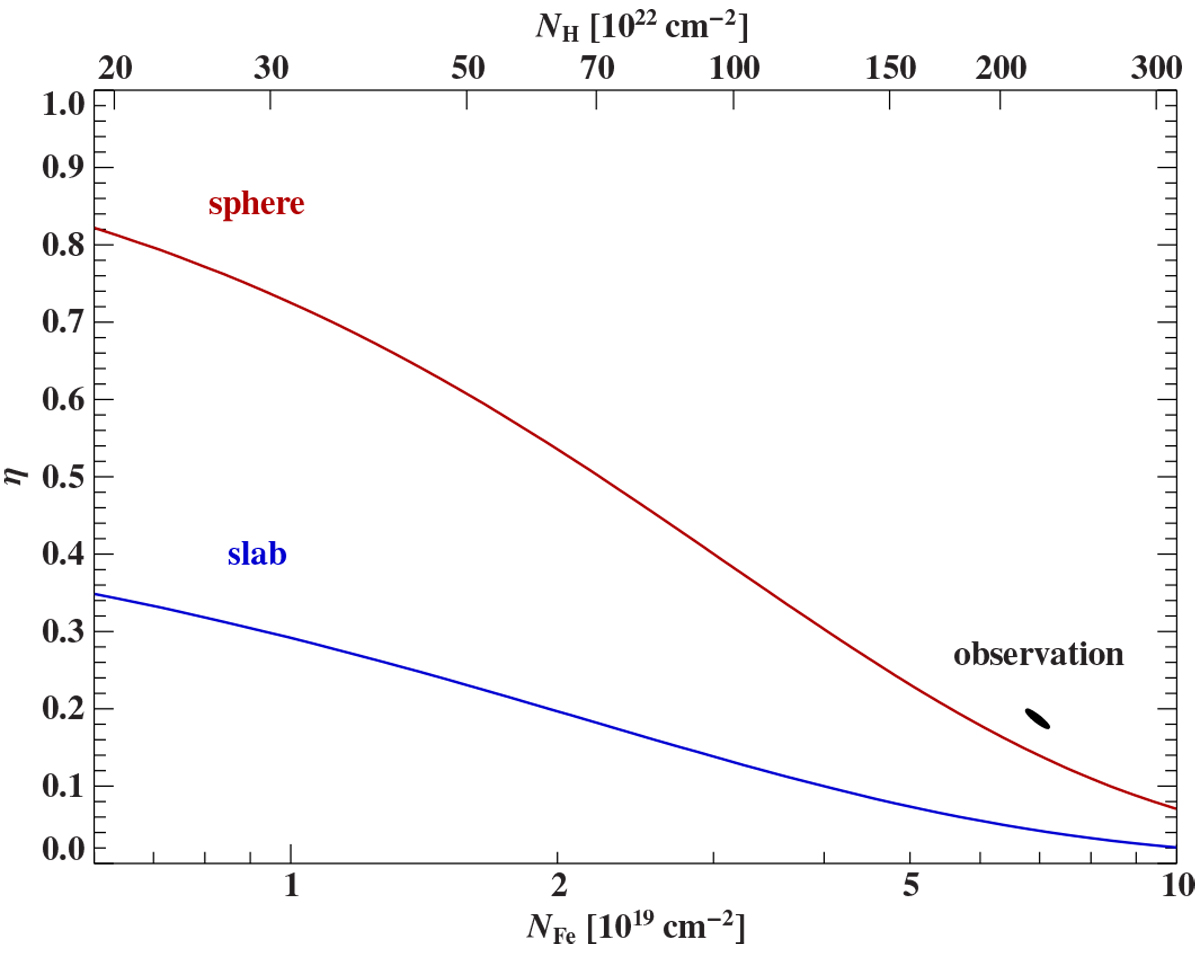
Correction factor η for sphericaland slab geometry (red and blue, respectively) as a function of column density obtained from Monte Carlo simulations. The black shaded region shows the 90% confidence contour from the MCMC spectral modeling.
Current usage metrics show cumulative count of Article Views (full-text article views including HTML views, PDF and ePub downloads, according to the available data) and Abstracts Views on Vision4Press platform.
Data correspond to usage on the plateform after 2015. The current usage metrics is available 48-96 hours after online publication and is updated daily on week days.
Initial download of the metrics may take a while.