Fig. 4.
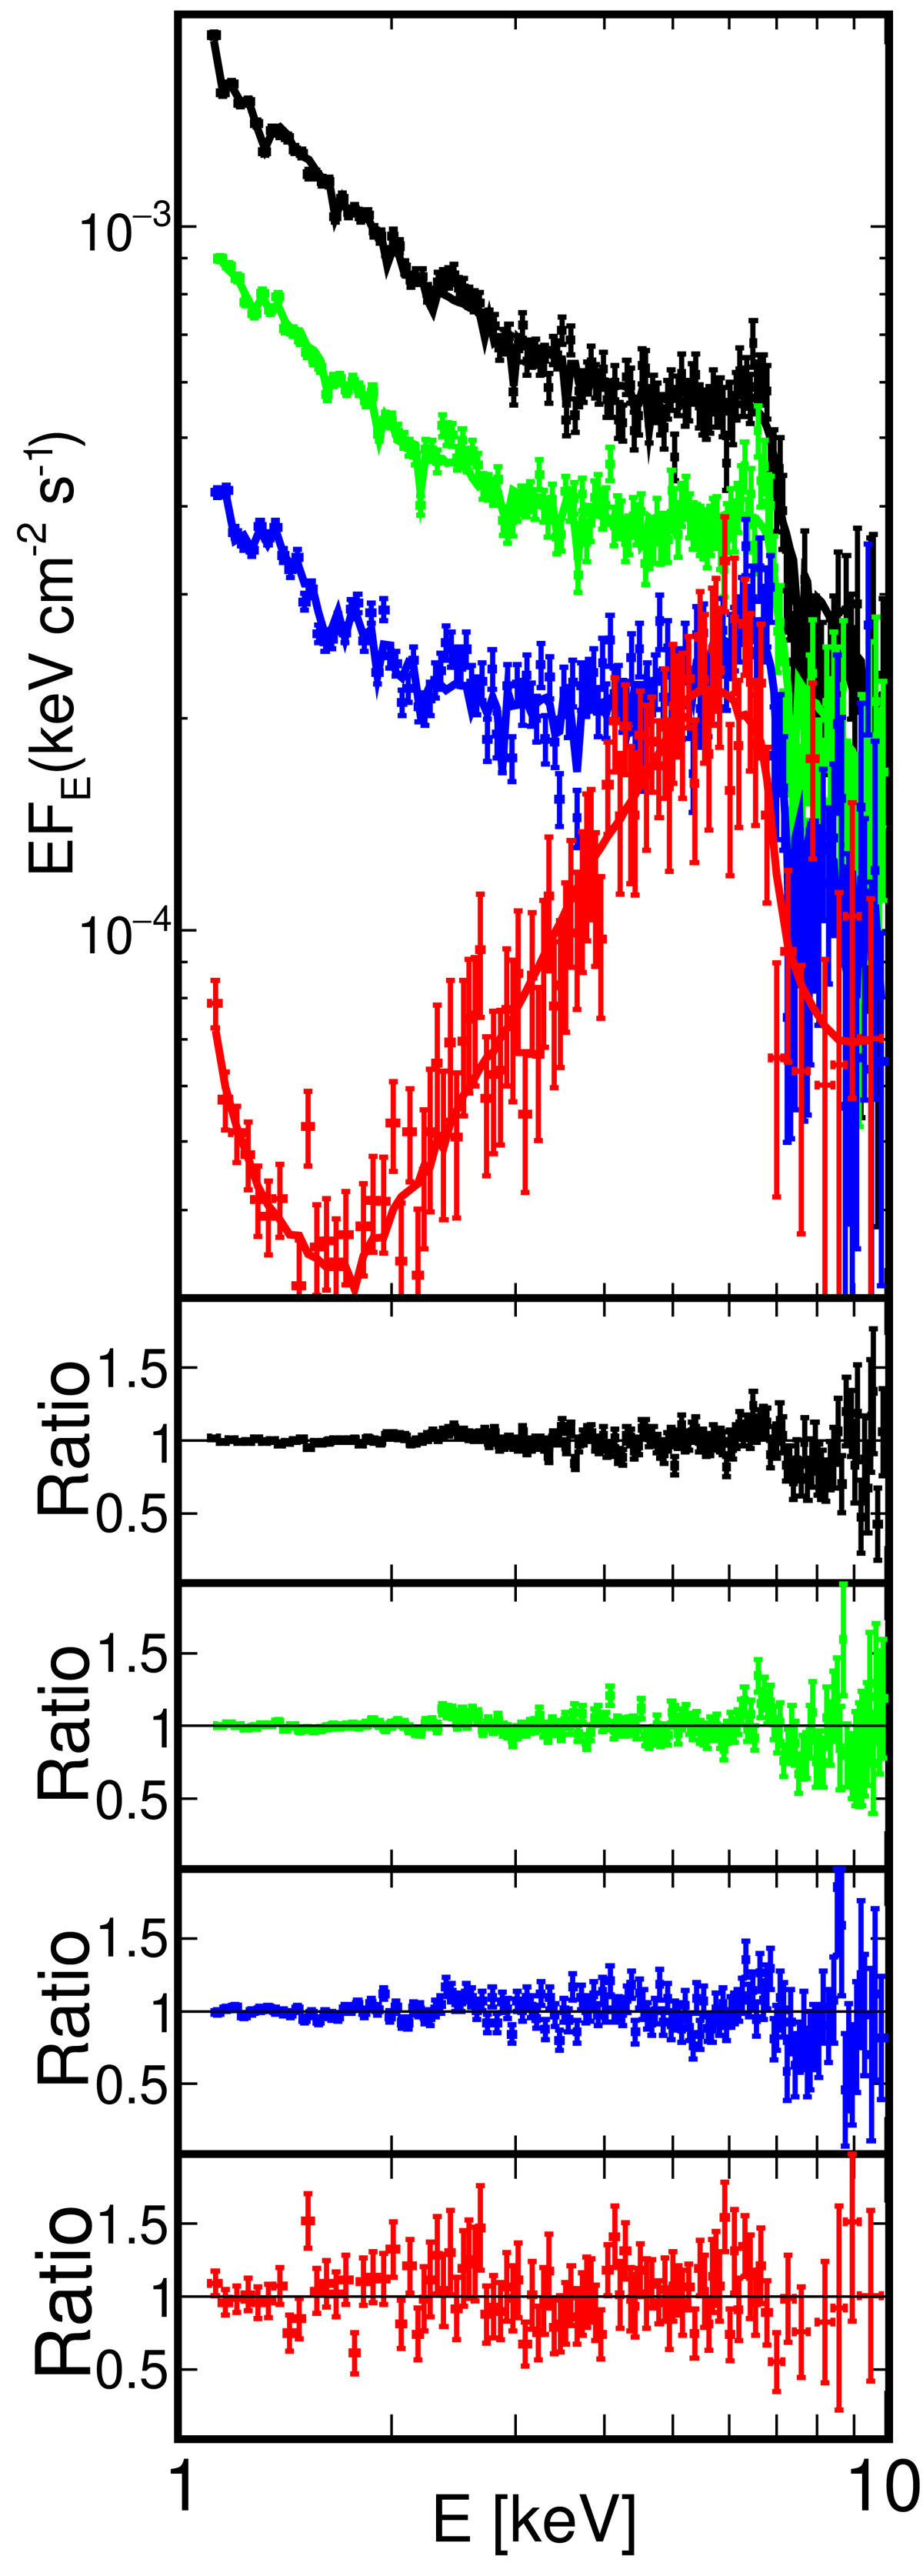
Top panel: unfolded data and model spectra for our best-fitted models for VL (red), L (blue), M (green), and H (black) using zxipcf*reflkerr_elp. Spectral binning (1) was used. The model parameters are given in Table 4. The model is shown by the solid curve. Bottom panel: fit residuals given as the data-to-model ratio for VL, L, M, and H from bottom to top.
Current usage metrics show cumulative count of Article Views (full-text article views including HTML views, PDF and ePub downloads, according to the available data) and Abstracts Views on Vision4Press platform.
Data correspond to usage on the plateform after 2015. The current usage metrics is available 48-96 hours after online publication and is updated daily on week days.
Initial download of the metrics may take a while.