Fig. 1.
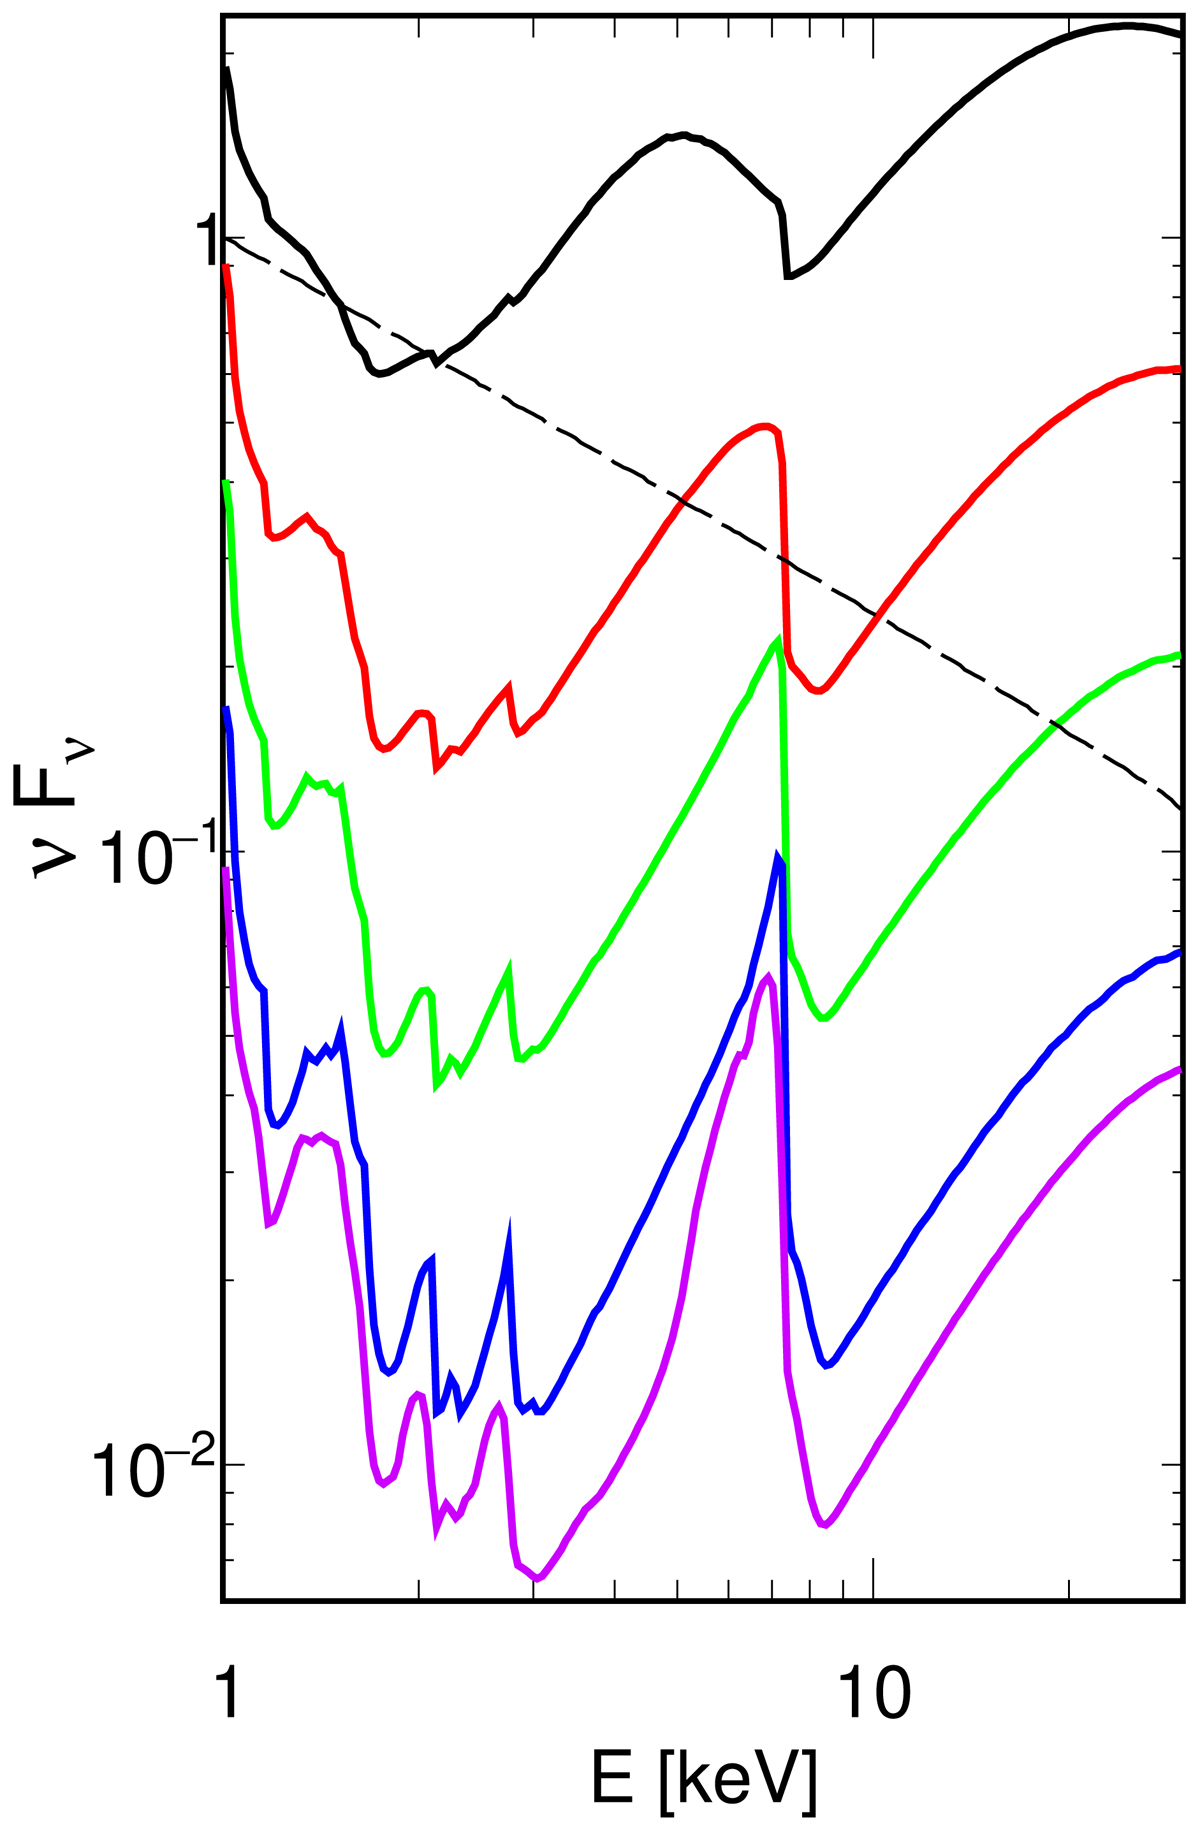
Illustration of changes of the reflection spectrum resulting from the contraction of the X-ray source, described by the decrease of both hmax and rc, for Γ = 2.6, ξ = 50, ZFe = 9, i = 50°, ℛ = 1, a = 0.998, hmin = 0, and rin = rISCO. The reflection spectra, shown by solid curves, correspond to hmax = rc = 1.3 (black), 2 (red), 3 (green), 8 (blue), and 30 (magenta) from top to bottom. The primary spectrum is the same in all cases and is shown by the dashed line.
Current usage metrics show cumulative count of Article Views (full-text article views including HTML views, PDF and ePub downloads, according to the available data) and Abstracts Views on Vision4Press platform.
Data correspond to usage on the plateform after 2015. The current usage metrics is available 48-96 hours after online publication and is updated daily on week days.
Initial download of the metrics may take a while.