Fig. 5.
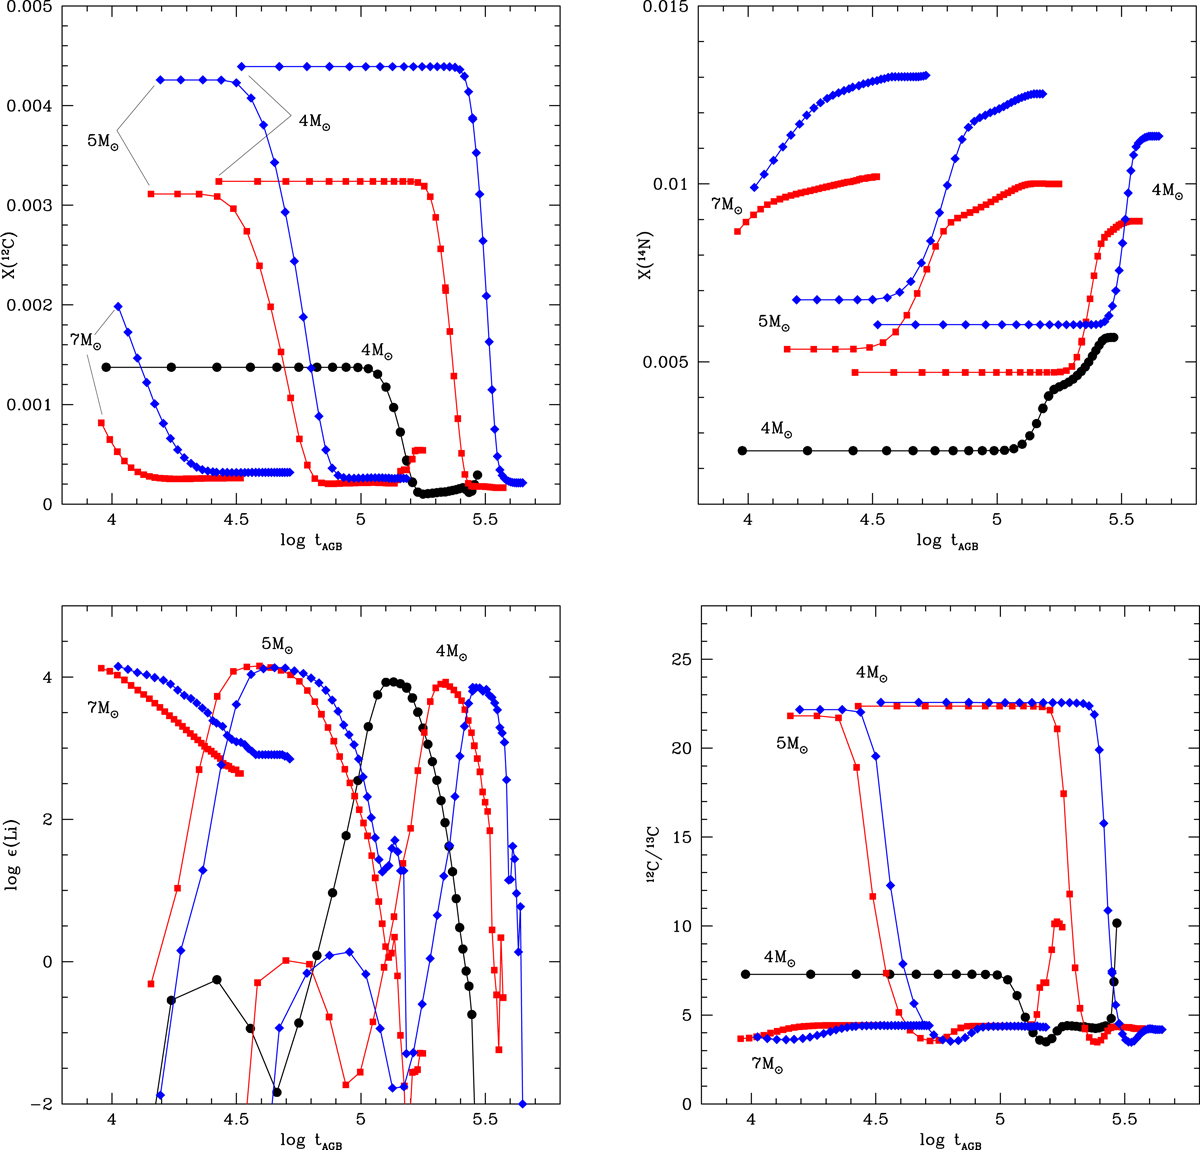
Variations with time of the surface mass fraction of 12C (top-left panel), 14N (top right), lithium (bottom left), and the 12C/13C ratio (bottom right) of the same models shown in Fig. 4 (except for the 6 M⊙ model, omitted here for the sake of readibility). The black dots refer to a 4 M⊙ star of solar metallicity, published in Ventura et al. (2018), while the other symbols are the same as in Fig. 4.
Current usage metrics show cumulative count of Article Views (full-text article views including HTML views, PDF and ePub downloads, according to the available data) and Abstracts Views on Vision4Press platform.
Data correspond to usage on the plateform after 2015. The current usage metrics is available 48-96 hours after online publication and is updated daily on week days.
Initial download of the metrics may take a while.