Fig. 3.
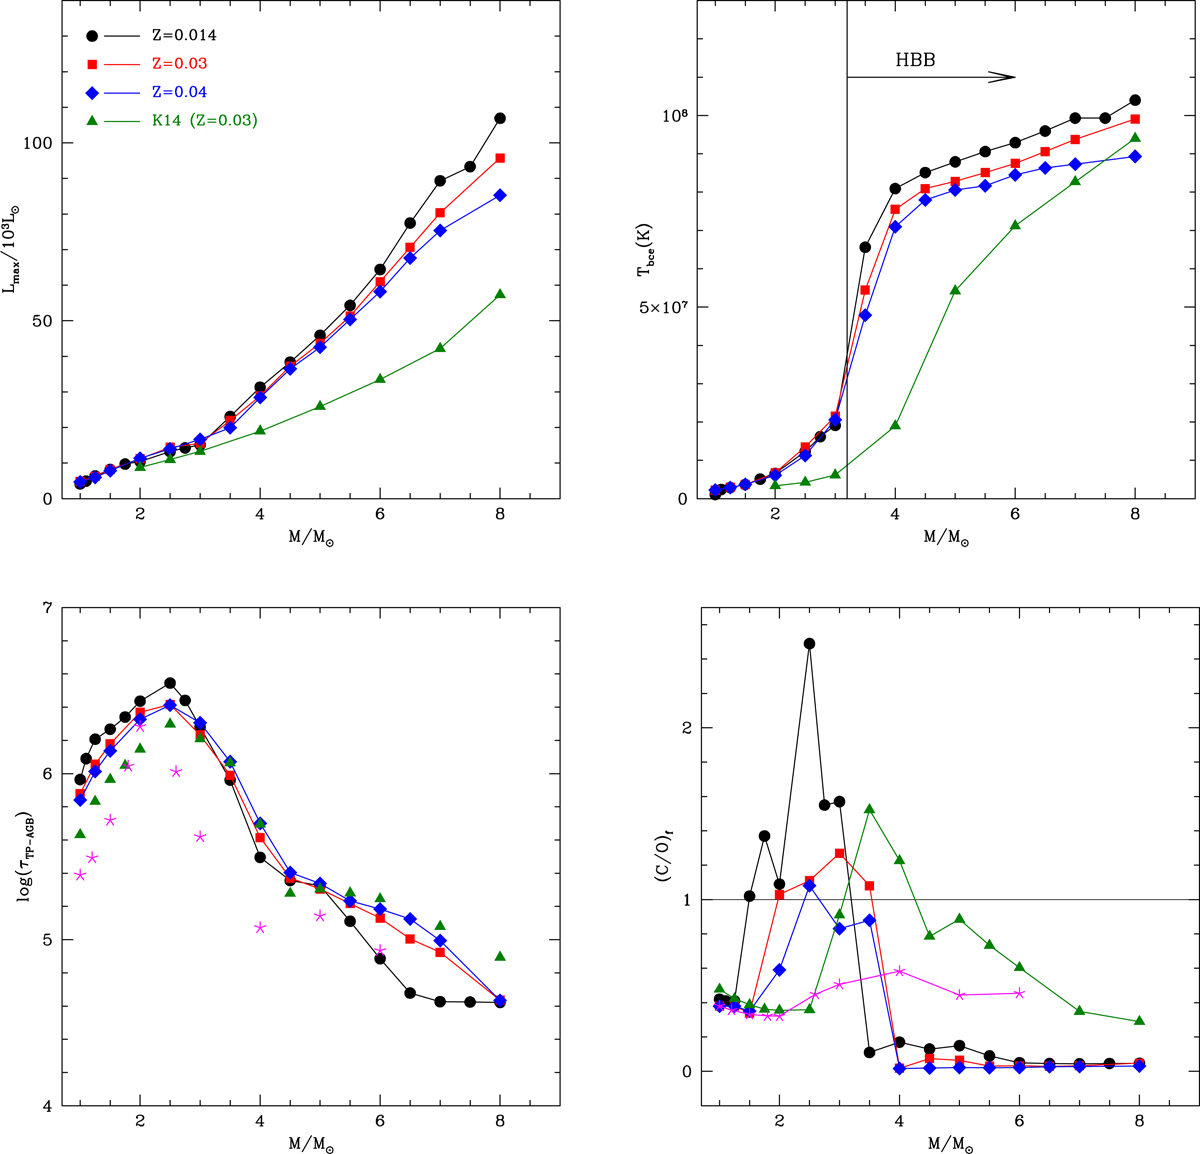
Maximum luminosity (top-left panel) and temperature at the base of the envelope (top, right) experienced by our AGB models of metallicity Z = 0.03 (red squares) and Z = 0.04 (blue diamonds) as a function of the initial mass. The bottom panels show the duration of the TP-AGB phase (left) and the final C/O (right). For comparison, we also show solar metallicity models by Ventura et al. (2018) (black points), Z = 0.03 models by Karakas (2014) (green triangles), and Z = 0.04 models by Weiss & Ferguson (2009) (magenta asterisks).
Current usage metrics show cumulative count of Article Views (full-text article views including HTML views, PDF and ePub downloads, according to the available data) and Abstracts Views on Vision4Press platform.
Data correspond to usage on the plateform after 2015. The current usage metrics is available 48-96 hours after online publication and is updated daily on week days.
Initial download of the metrics may take a while.