Fig. 7
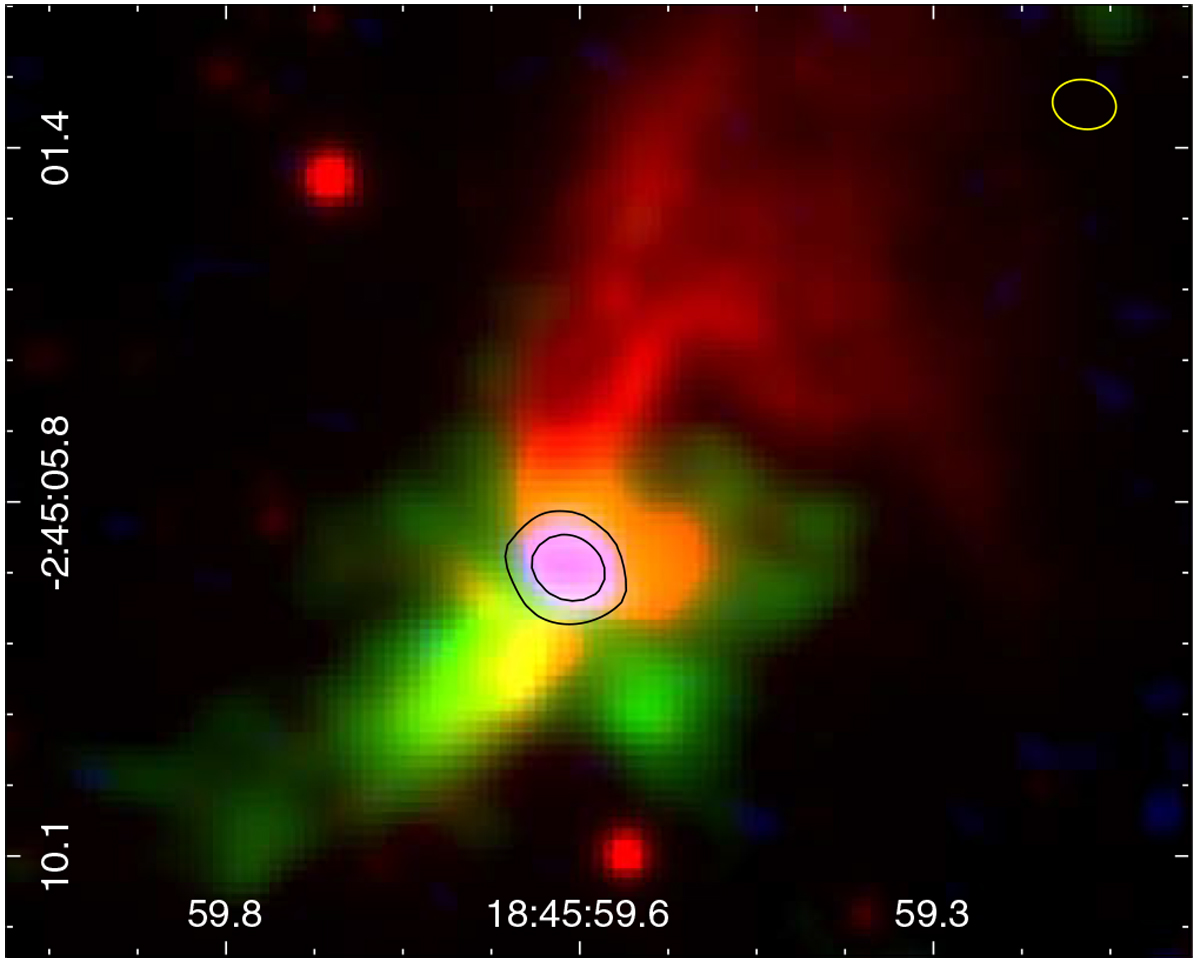
Three-colour image composed of Gemini NIRI Ks emission (red) and the integrated emission of CH3OCHO (green) and CH3CN (blue) as presented in Fig. 4. The black contours are the integrated CH3CN emission at levels 1.5 and 5.0 Jy beam−1 km s−1. The beam of the ALMA data is displayed in the top right corner.
Current usage metrics show cumulative count of Article Views (full-text article views including HTML views, PDF and ePub downloads, according to the available data) and Abstracts Views on Vision4Press platform.
Data correspond to usage on the plateform after 2015. The current usage metrics is available 48-96 hours after online publication and is updated daily on week days.
Initial download of the metrics may take a while.