Fig. 4
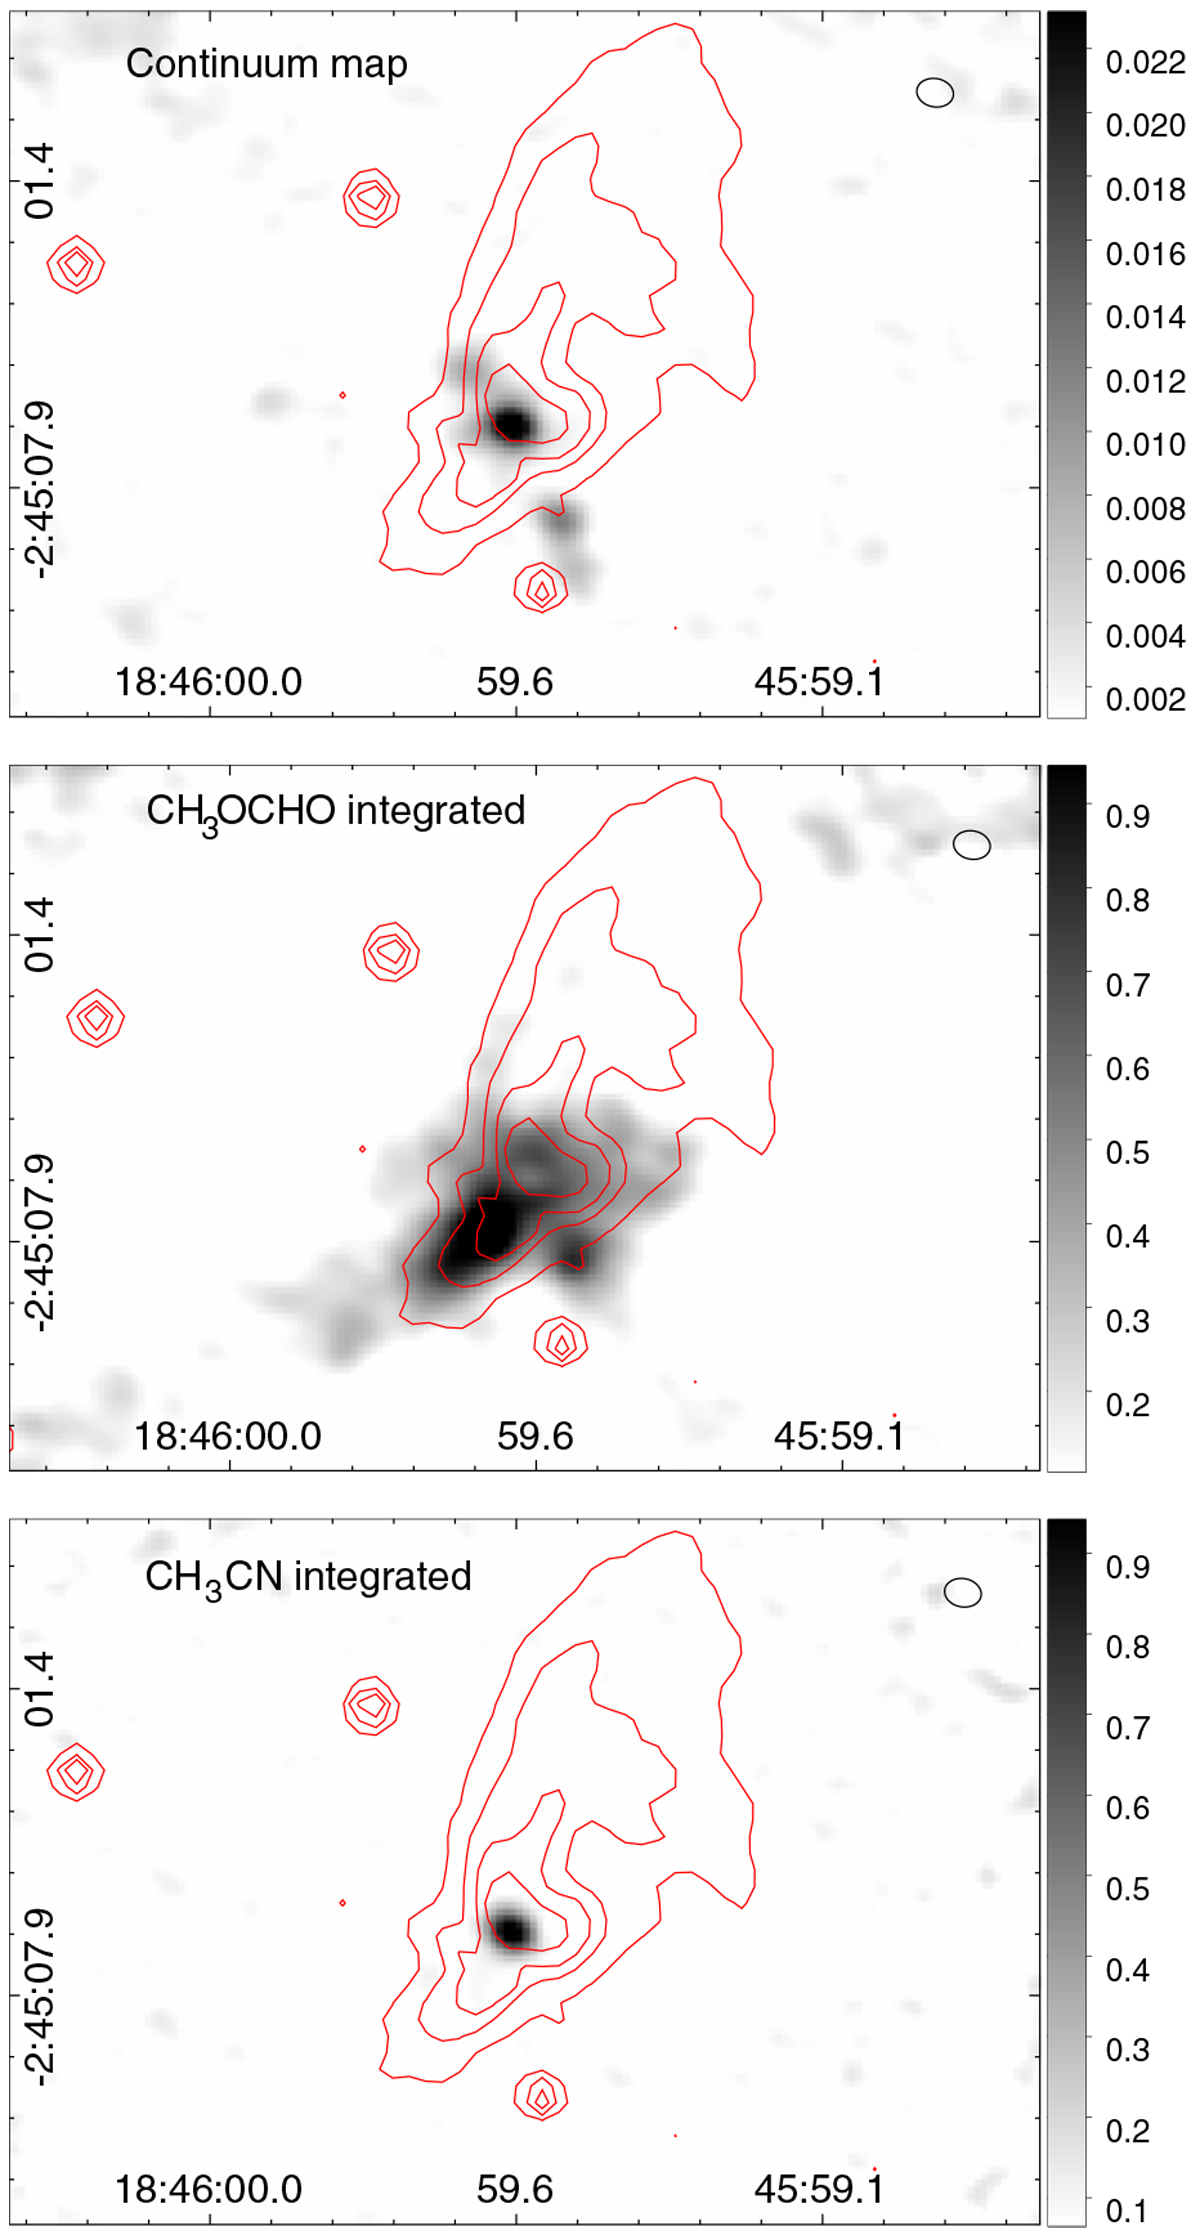
Top: ALMA continuum map at 1.3 mm of G29-YSO. The colour scale is in Jy beam−1, and the rms noise level is 0.001 Jy beam−1. Middle and bottom panels: maps of the CH3OCHO 20(2,19)–19(2,18)E emission integrated between 95 and 107 km s−1, and the CH3CN J = 13–12 K = 0 emission integrated between 98 and 105 km s−1, respectively. The colour scale is in Jy beam−1 km s−1. The rms noise levels are 0.10, and 0.05 Jy beam−1 km s−1, respectively.The beam of the ALMA data is included in the top right corner of each panel. Red contours correspond to the Ks-emission obtained with Gemini and are included for reference.
Current usage metrics show cumulative count of Article Views (full-text article views including HTML views, PDF and ePub downloads, according to the available data) and Abstracts Views on Vision4Press platform.
Data correspond to usage on the plateform after 2015. The current usage metrics is available 48-96 hours after online publication and is updated daily on week days.
Initial download of the metrics may take a while.