Fig. 10
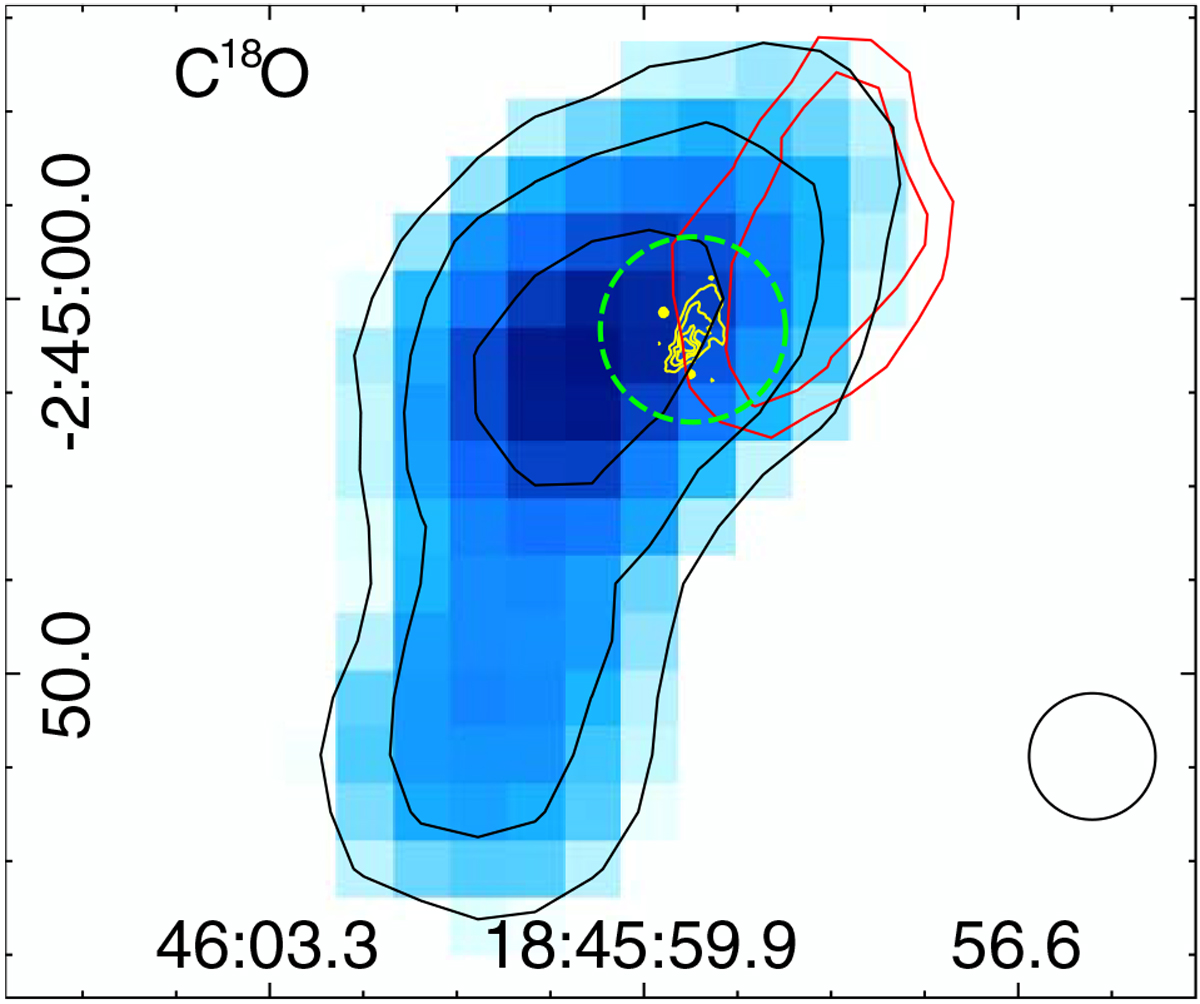
C18O J = 3–2 emission integrated between 99 and 104.5 km s−1. The contour levels are 5, 7, and 10 K km s−1. The red contour corresponds to the 12CO J = 3–2 emission integrated between 104 and 112 km s−1. The red contour levels are 40 and 50 K km s−1. The beam isincluded at the bottom right corner. The yellow contours correspond to the NIR Ks-emission obtained with Gemini. The dashed circle represents the pointing and the beam of the ASTE observations.
Current usage metrics show cumulative count of Article Views (full-text article views including HTML views, PDF and ePub downloads, according to the available data) and Abstracts Views on Vision4Press platform.
Data correspond to usage on the plateform after 2015. The current usage metrics is available 48-96 hours after online publication and is updated daily on week days.
Initial download of the metrics may take a while.