Open Access
Fig. 8.
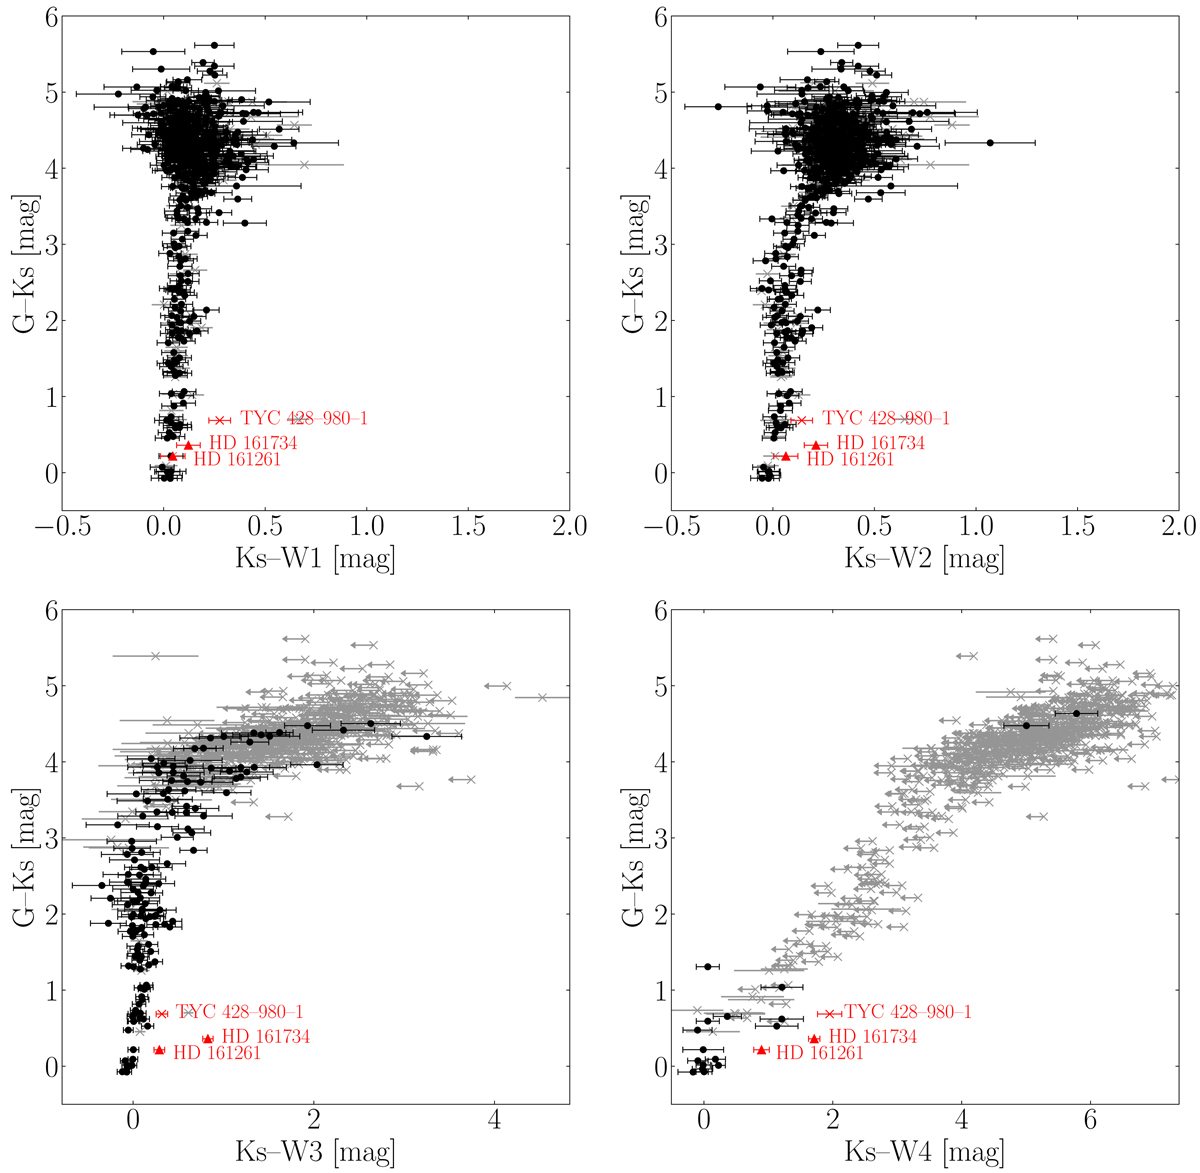
Colour–colour diagrams of the WISE photometric bands. Black dots indicate sources with good photometric quality, grey crosses indicate low-quality photometry or upper limits, and red triangles indicate an IR excess. The source TYC 428–980–1 (red cross) shows an IR excess but is flagged as an extended object (see text).
Current usage metrics show cumulative count of Article Views (full-text article views including HTML views, PDF and ePub downloads, according to the available data) and Abstracts Views on Vision4Press platform.
Data correspond to usage on the plateform after 2015. The current usage metrics is available 48-96 hours after online publication and is updated daily on week days.
Initial download of the metrics may take a while.