Fig. 3.
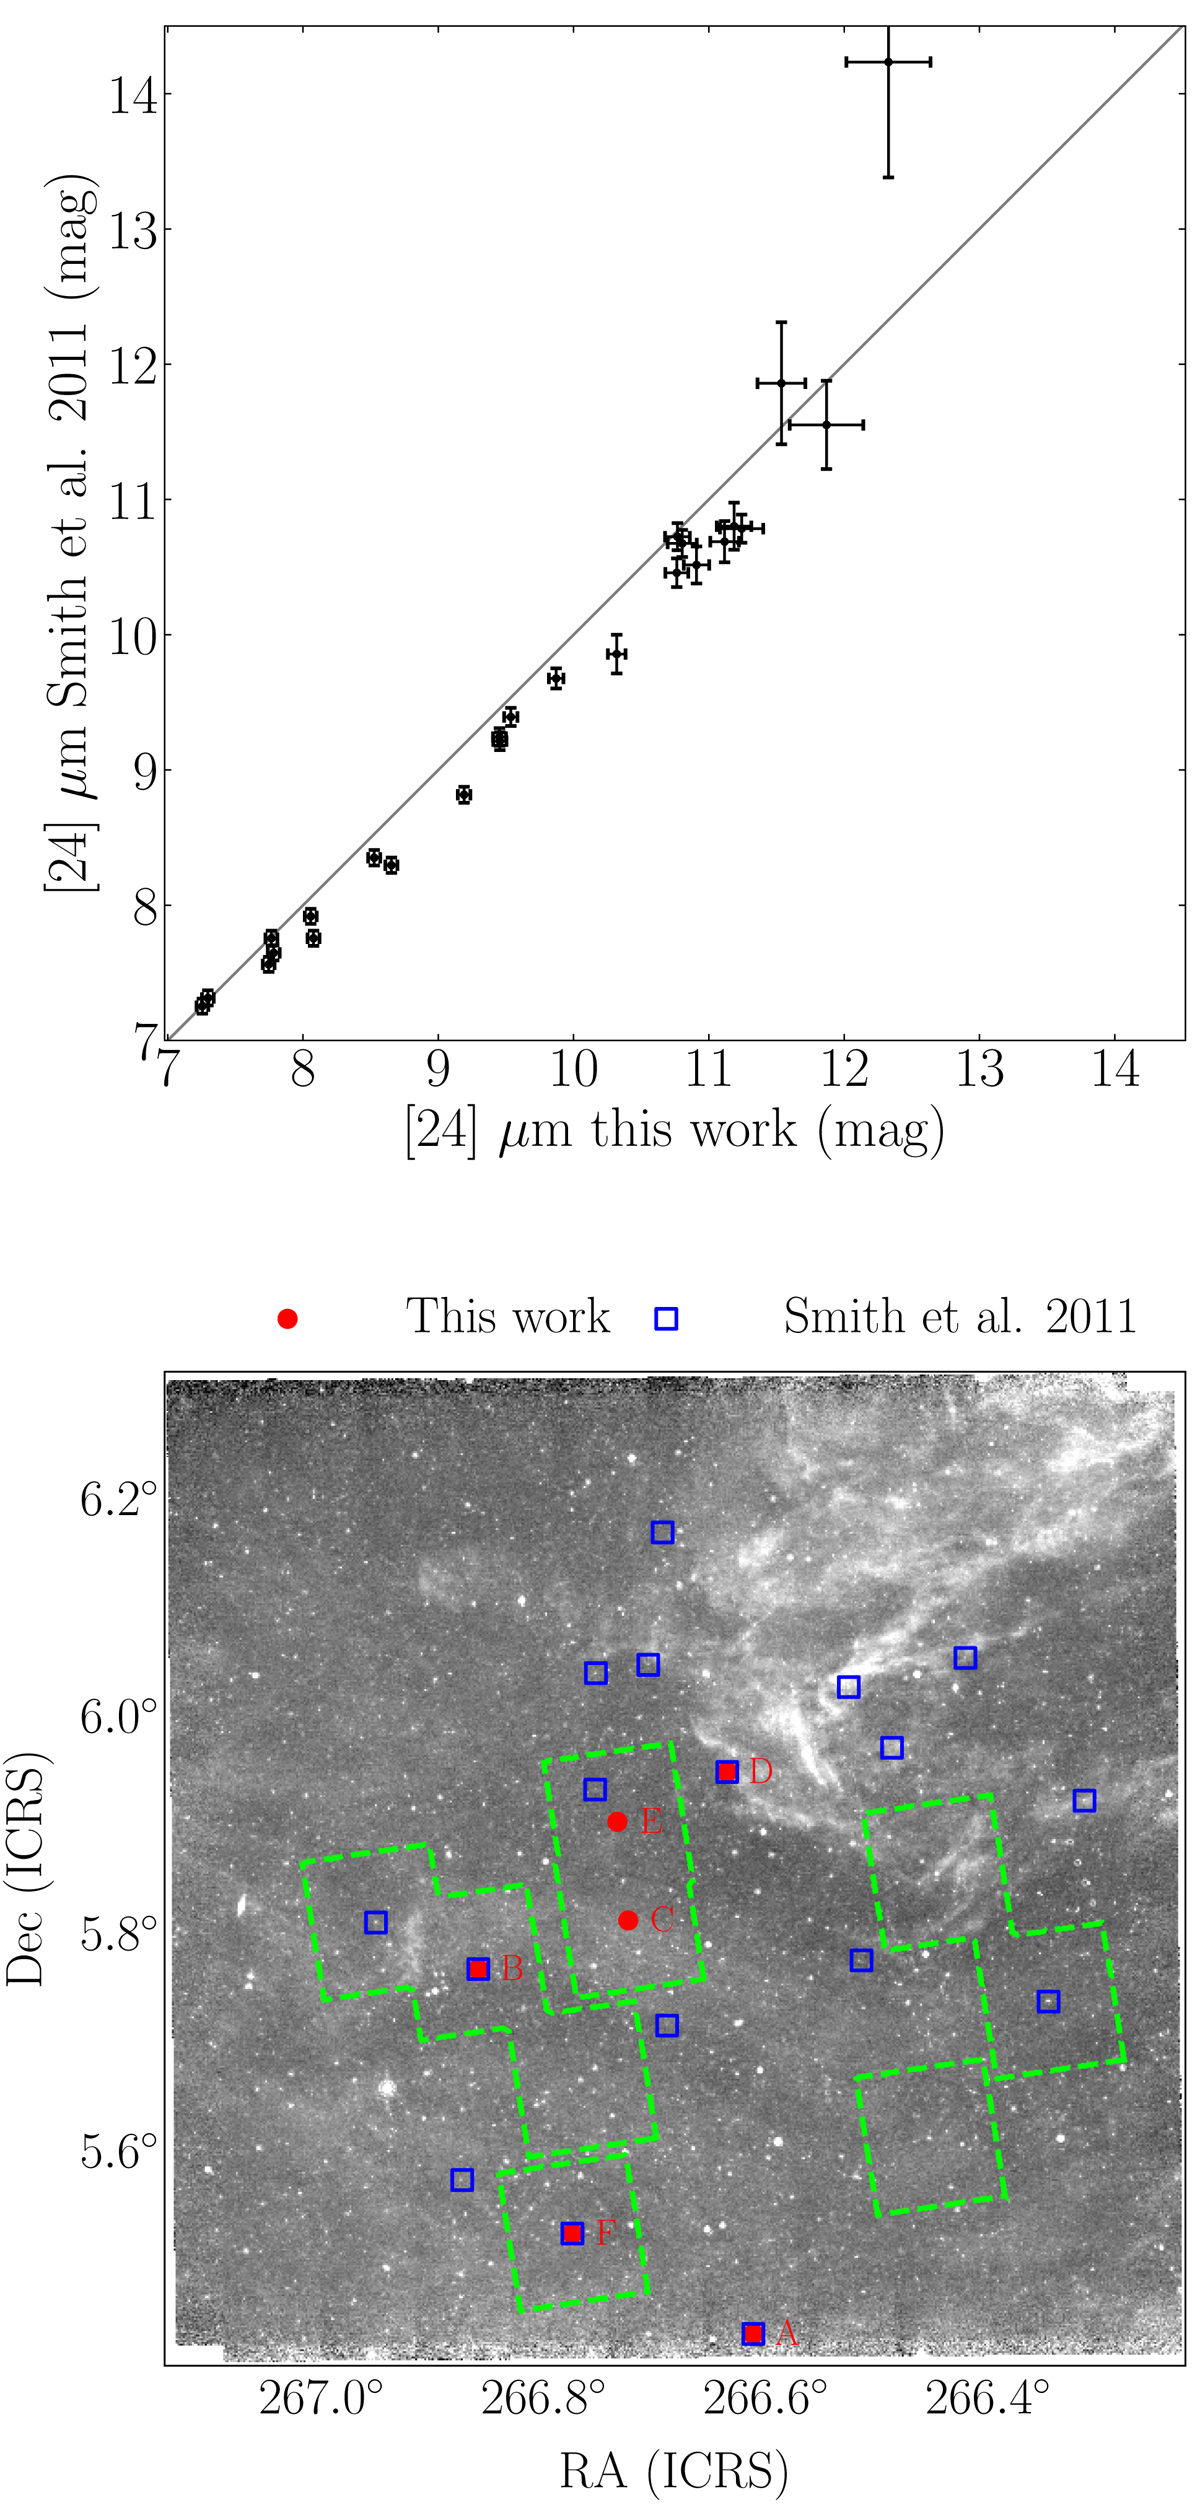
Top: comparison between the MIPS1 photometry obtained in this work and that published on Smith et al. (2011) for the common sources. Bottom: Spatial distribution of the sources with excess in this work (red dots, labelled as follows, A: 2MASS J17462472+0517213, B: HD 161733, C: HD 161621, D: TYC 428-1938-1, E: TYC 428-980-1, F: HD 161734) and in Smith et al. (2011) (blue squares). The areas limited by green lines indicate the coverage of the Spitzer program ID 3347 which was not included in Smith et al. (2011).
Current usage metrics show cumulative count of Article Views (full-text article views including HTML views, PDF and ePub downloads, according to the available data) and Abstracts Views on Vision4Press platform.
Data correspond to usage on the plateform after 2015. The current usage metrics is available 48-96 hours after online publication and is updated daily on week days.
Initial download of the metrics may take a while.