Fig. 10.
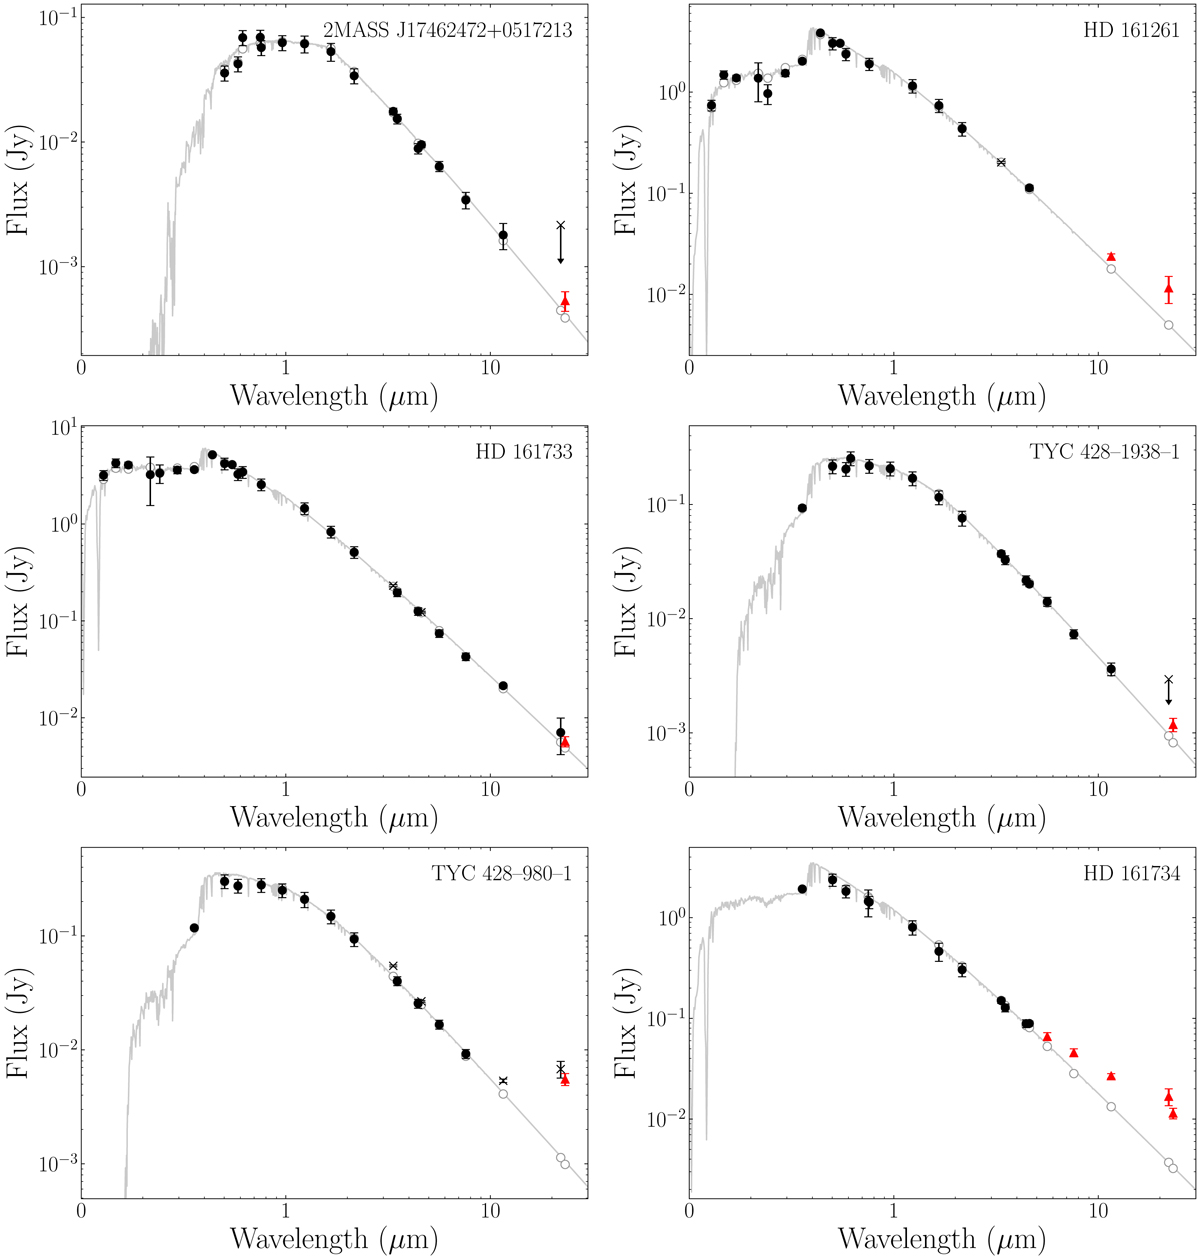
Spectral energy distributions of the sources for which we have detected an IR excess. The black dots indicate the photometric measurements used in the fit, the grey crosses indicate the photometric measures not used in the fit (either poor-quality photometry or upper limits), and the red triangles indicate a photometric excess detected by VOSA. We report the 3σ uncertainties, some of which are smaller than the markers. We note that the DANCe photometry has a minimum uncertainty of 0.05 mag. The grey line represents the photospheric best fitted Kurucz model.
Current usage metrics show cumulative count of Article Views (full-text article views including HTML views, PDF and ePub downloads, according to the available data) and Abstracts Views on Vision4Press platform.
Data correspond to usage on the plateform after 2015. The current usage metrics is available 48-96 hours after online publication and is updated daily on week days.
Initial download of the metrics may take a while.