Fig. 7
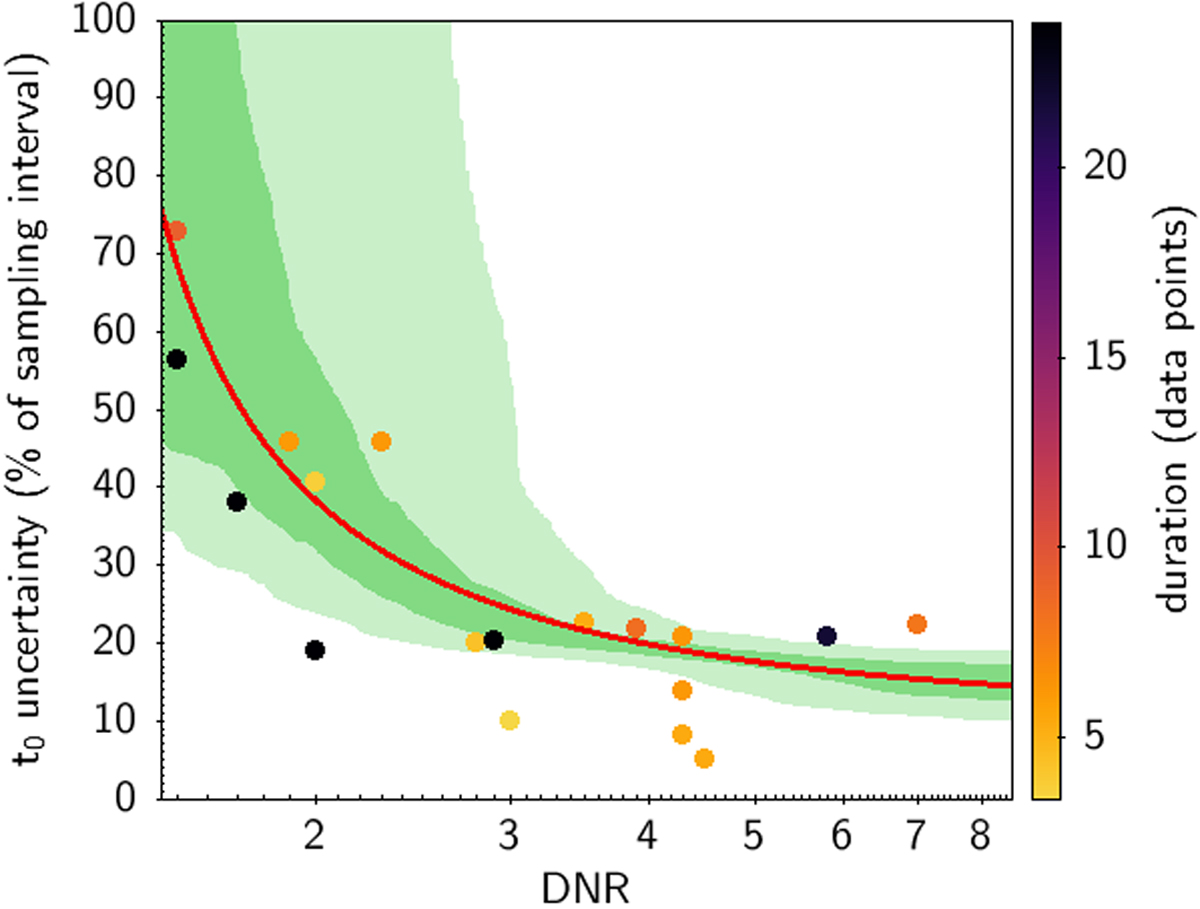
Drop-to-noise (DNR) ratio and uncertainty on central epoch for a number of observed events similar to those adopted for the simulation. They appear as coloured circles superposed on the general trend of Fig. 4 from which we reproduce only the average (red) and the one to two sigma levels. The colour of the circles is associated to the number of data points in the occultation minimum, indicated by the scale at the right of the plot.
Current usage metrics show cumulative count of Article Views (full-text article views including HTML views, PDF and ePub downloads, according to the available data) and Abstracts Views on Vision4Press platform.
Data correspond to usage on the plateform after 2015. The current usage metrics is available 48-96 hours after online publication and is updated daily on week days.
Initial download of the metrics may take a while.