Fig. 6
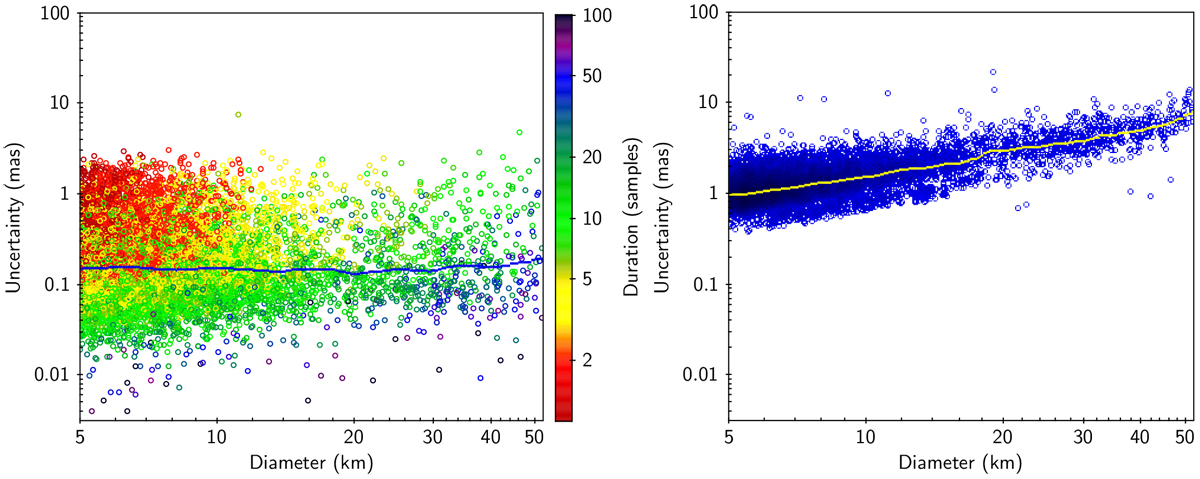
Expected distribution of the astrometric uncertainty on the single chord estimated by our accuracy model, applied to a large set of predictions. Left panel: only the component of the uncertainty relative to the fit of each light curve by the BIM is taken into account. The colour corresponds to the chord length, expressed as the number of data points within the light curve minimum. Right panel: uncertainty including the AT error as derived from a simple model (half of the asteroid apparent radius, computed for each event). The continuous lines are the smoothed averages of the two distributions. For D < 10 km and occultation duration <5 samples, theuncertainty due to asteroid size no longer dominates and the distributions overlap.
Current usage metrics show cumulative count of Article Views (full-text article views including HTML views, PDF and ePub downloads, according to the available data) and Abstracts Views on Vision4Press platform.
Data correspond to usage on the plateform after 2015. The current usage metrics is available 48-96 hours after online publication and is updated daily on week days.
Initial download of the metrics may take a while.