Fig. 4
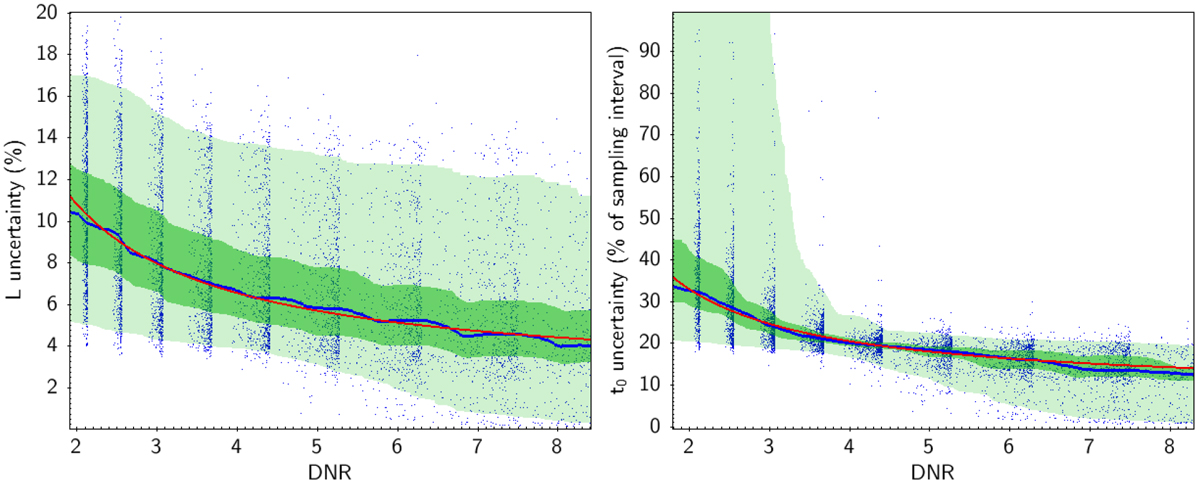
Uncertainty on the duration L and the centre epoch t0 of the occultation, as a function of the DNR, estimated by the standard deviation of the posterior distribution, after Bayesian modelling. Each dot represents a result obtained from a simulated occultation. The continuous blue line is the smoothed average value, while the shaded areas enclose the quantiles equivalent to 1-σ and 2-σ. The trend ~1/DNR, explainedin the text, is represented by the red line. The uncertainty is expressed, respectively, as percentage of duration, and of the exposure time. The clustering of the blue data points around discrete DNR values is a consequence of the choice of a discrete V* distribution,but it does not affect the estimation of the general trend.
Current usage metrics show cumulative count of Article Views (full-text article views including HTML views, PDF and ePub downloads, according to the available data) and Abstracts Views on Vision4Press platform.
Data correspond to usage on the plateform after 2015. The current usage metrics is available 48-96 hours after online publication and is updated daily on week days.
Initial download of the metrics may take a while.