Fig. 3
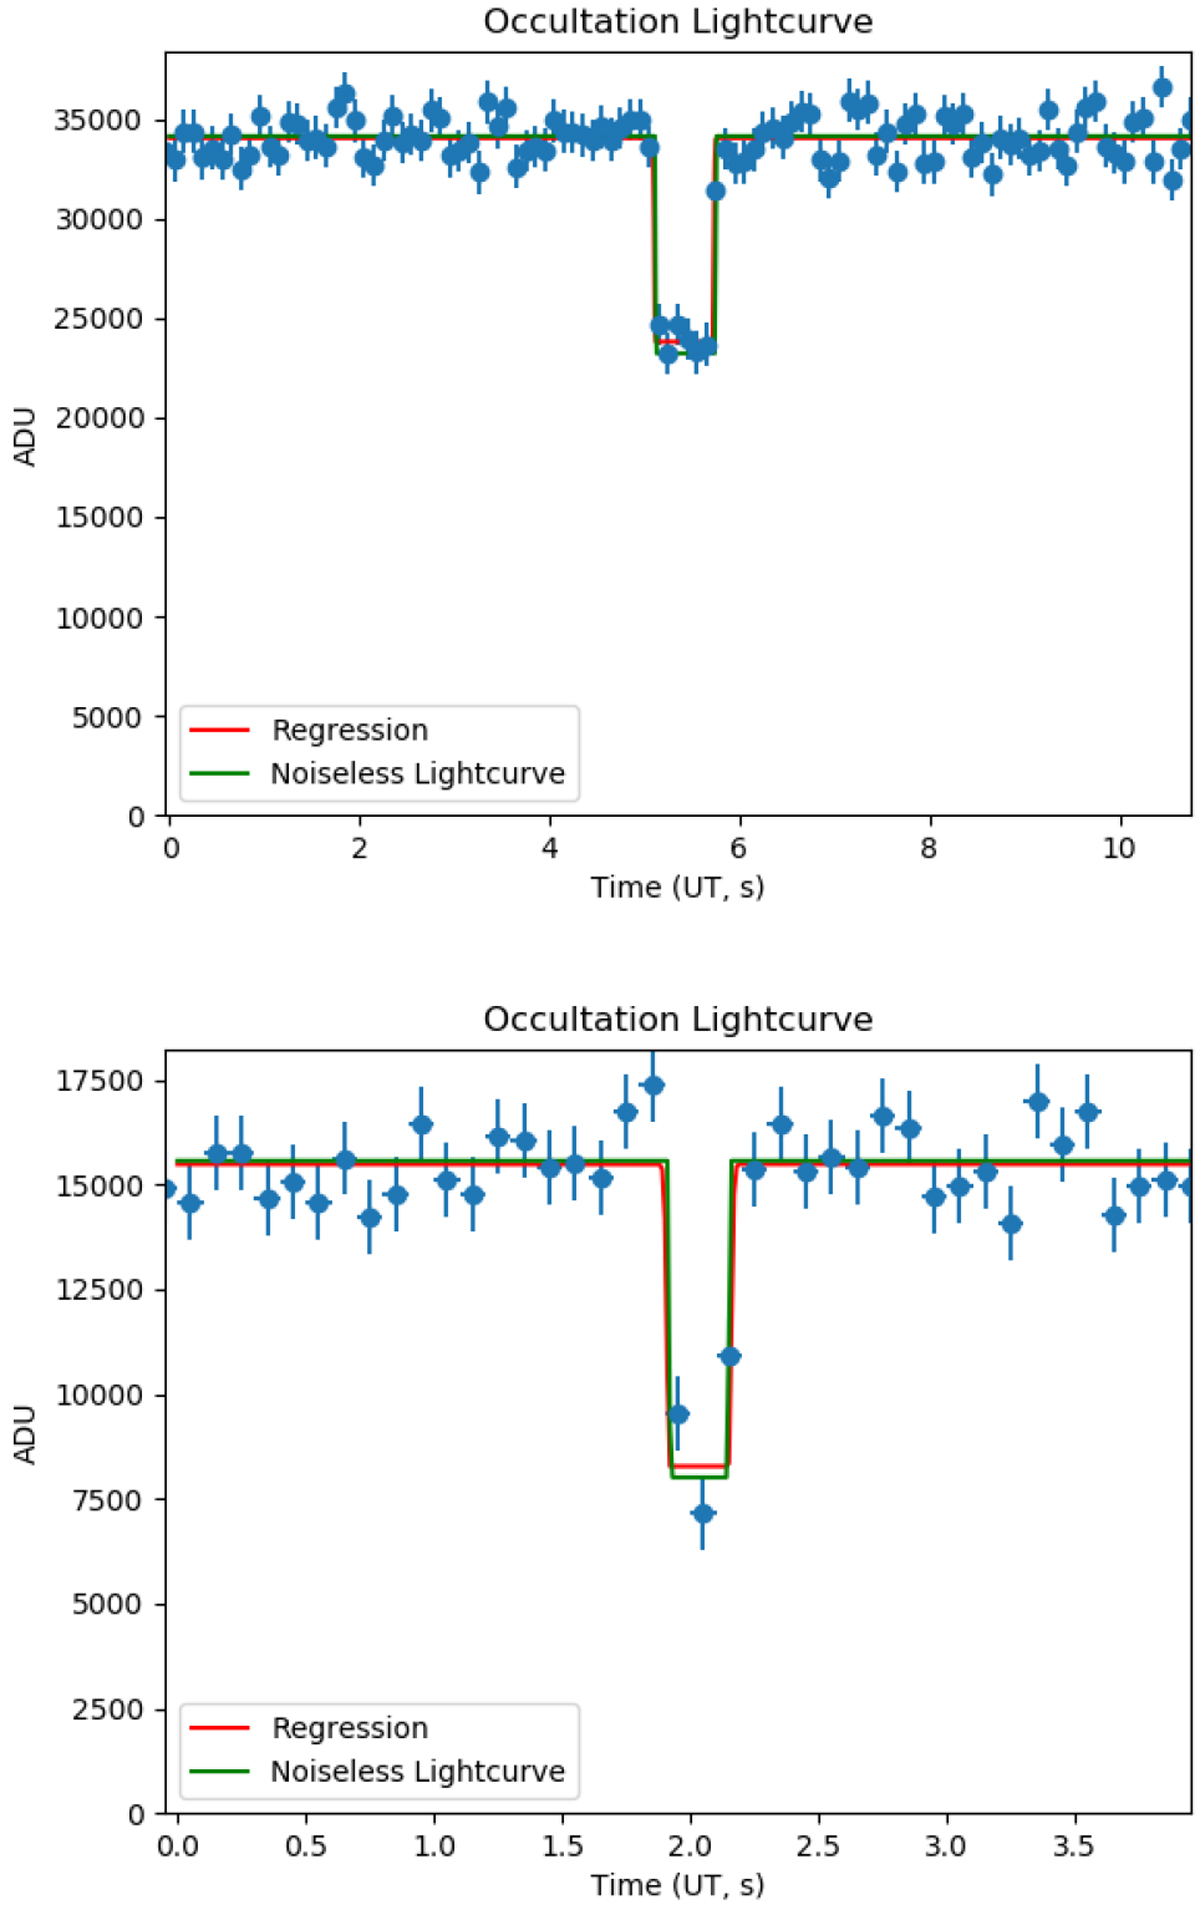
Examples of simulated light curves (green line), sampled with our noise model at dt = 0.1 s (blue dots). The associated blue bars represent the one-sigma uncertainties derived from the noise model. Regression is obtained through the method explained in Sect. 5 (red). Top panel: V* = 12.5, drop of 0.4 magnitudes, nine samples, DNR = 4.9. Bottom panel: V* = 13.5, drop of 0.7 magnitudes and two samples, DNR = 2.1.
Current usage metrics show cumulative count of Article Views (full-text article views including HTML views, PDF and ePub downloads, according to the available data) and Abstracts Views on Vision4Press platform.
Data correspond to usage on the plateform after 2015. The current usage metrics is available 48-96 hours after online publication and is updated daily on week days.
Initial download of the metrics may take a while.