Fig. 4
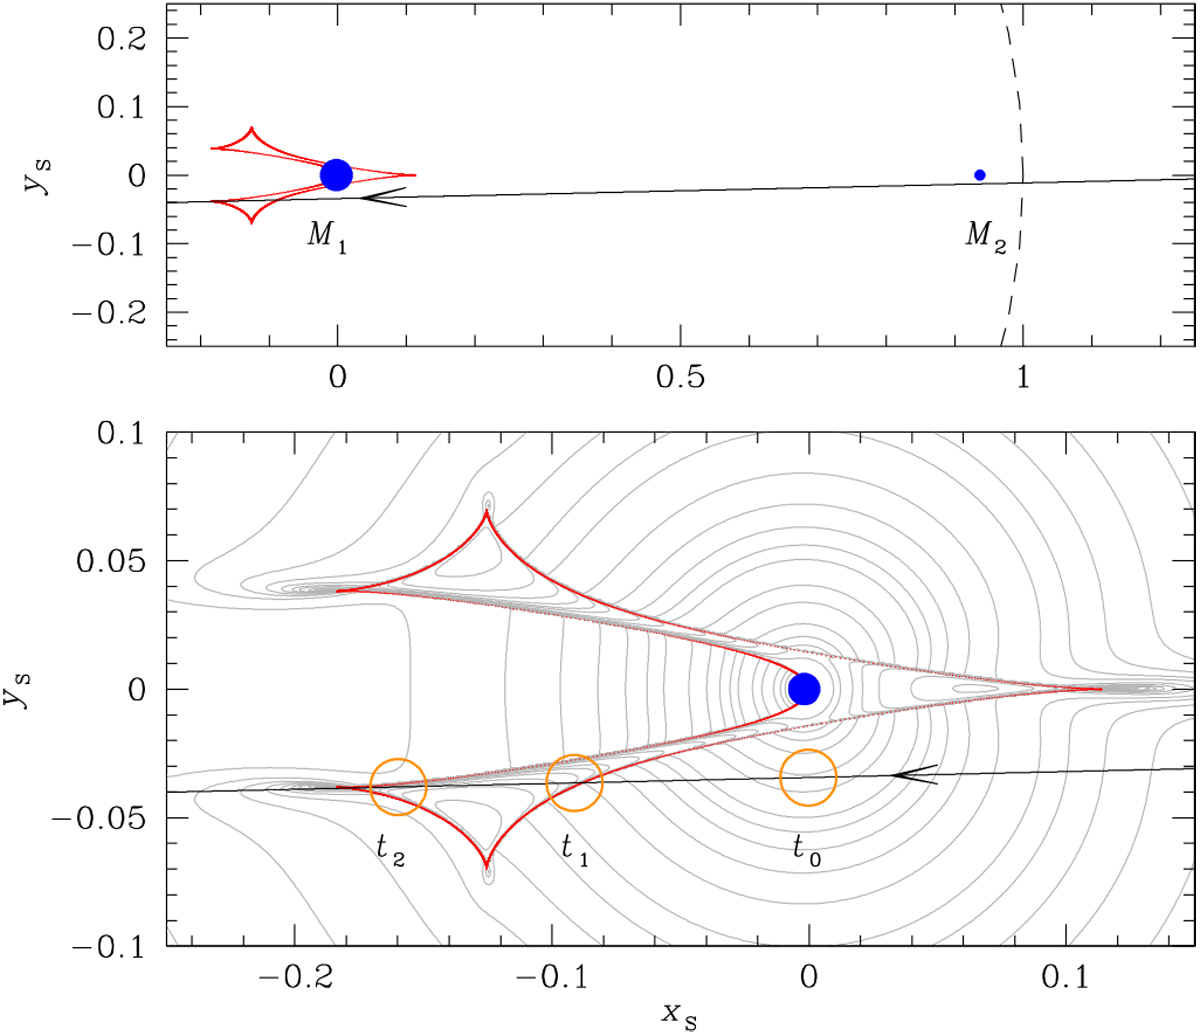
Configuration of the lens system for the 2L1S solution. Upper panel: zoomed-out region encompassing the binary lens components, the blue dots marked by M1 and M2; lower panel:zoomed-in view of the central magnification region. The line with an arrow indicates the source trajectory, the cuspy closed curve is the caustic, and the dashed circle in the upper panel represents the Einstein ring. In the lower panel, the three empty circles on the trajectory of the source indicate the source locations corresponding to the times of t0, t1, and t2 delineated inFig. 2. The circle size is scaled to θE. The gray curves in the lower panel represent equi-magnification contours.
Current usage metrics show cumulative count of Article Views (full-text article views including HTML views, PDF and ePub downloads, according to the available data) and Abstracts Views on Vision4Press platform.
Data correspond to usage on the plateform after 2015. The current usage metrics is available 48-96 hours after online publication and is updated daily on week days.
Initial download of the metrics may take a while.