Fig. 2
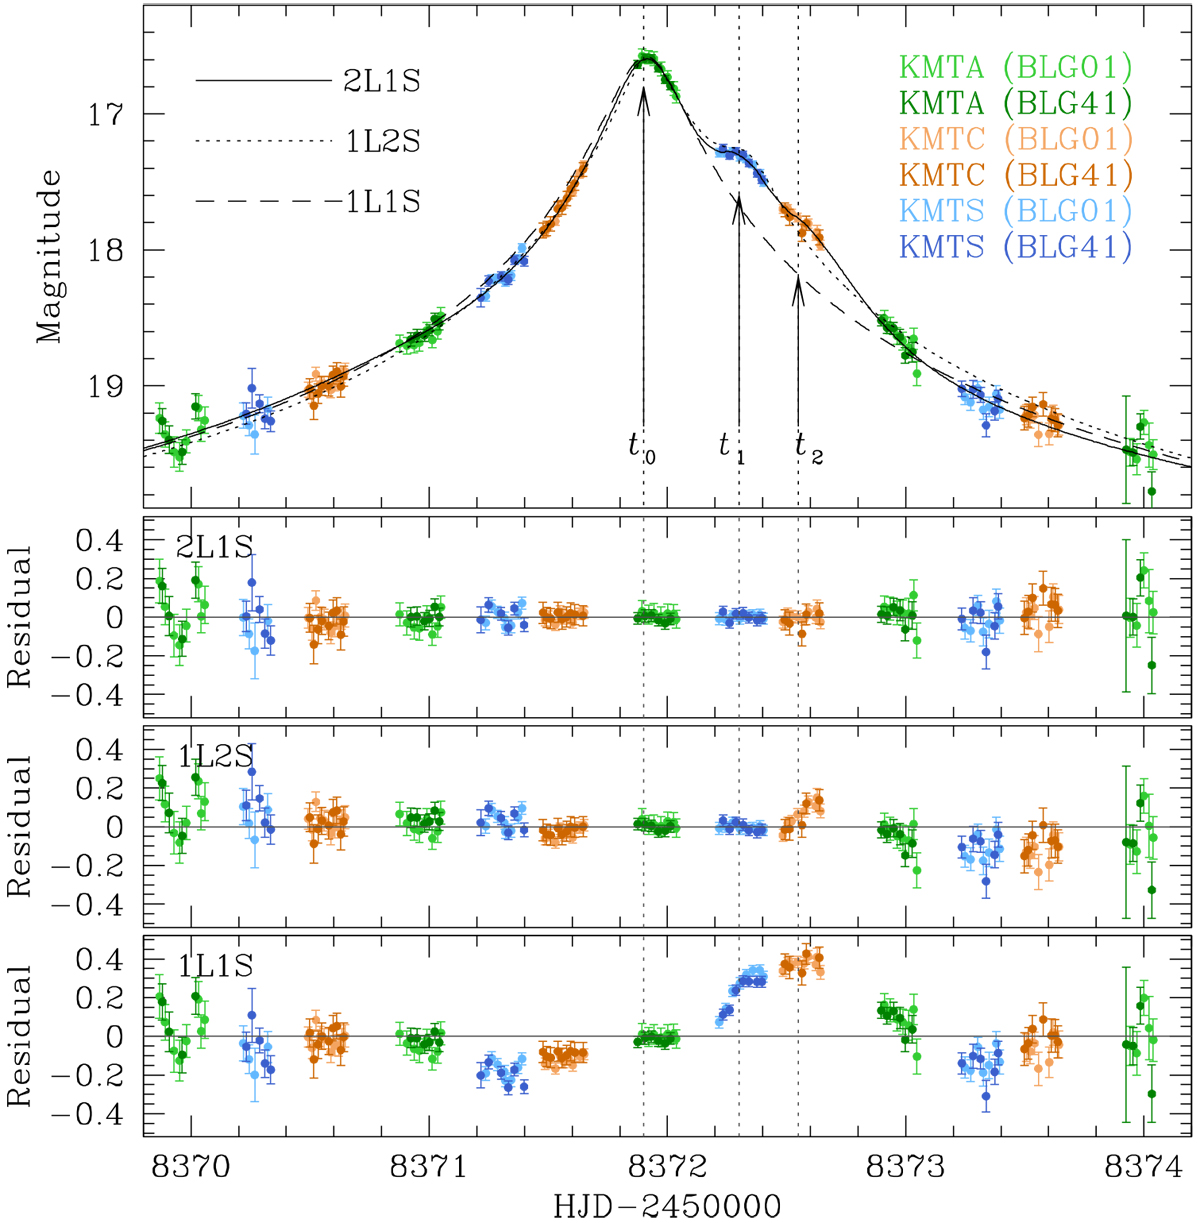
Various tested models and their residuals. Upper panel: three tested models, 2L1S (solid curve), 1L2S (dotted curve), and 1L1S (dashed curve) models; three lower panels: residuals from the individual models. The three times denoted at t0 ~ 8371.9, t1 ~ 8372.3, and t2 ~ 8372.6 represent the peak time, and the two bumps, respectively.
Current usage metrics show cumulative count of Article Views (full-text article views including HTML views, PDF and ePub downloads, according to the available data) and Abstracts Views on Vision4Press platform.
Data correspond to usage on the plateform after 2015. The current usage metrics is available 48-96 hours after online publication and is updated daily on week days.
Initial download of the metrics may take a while.