Fig. 7
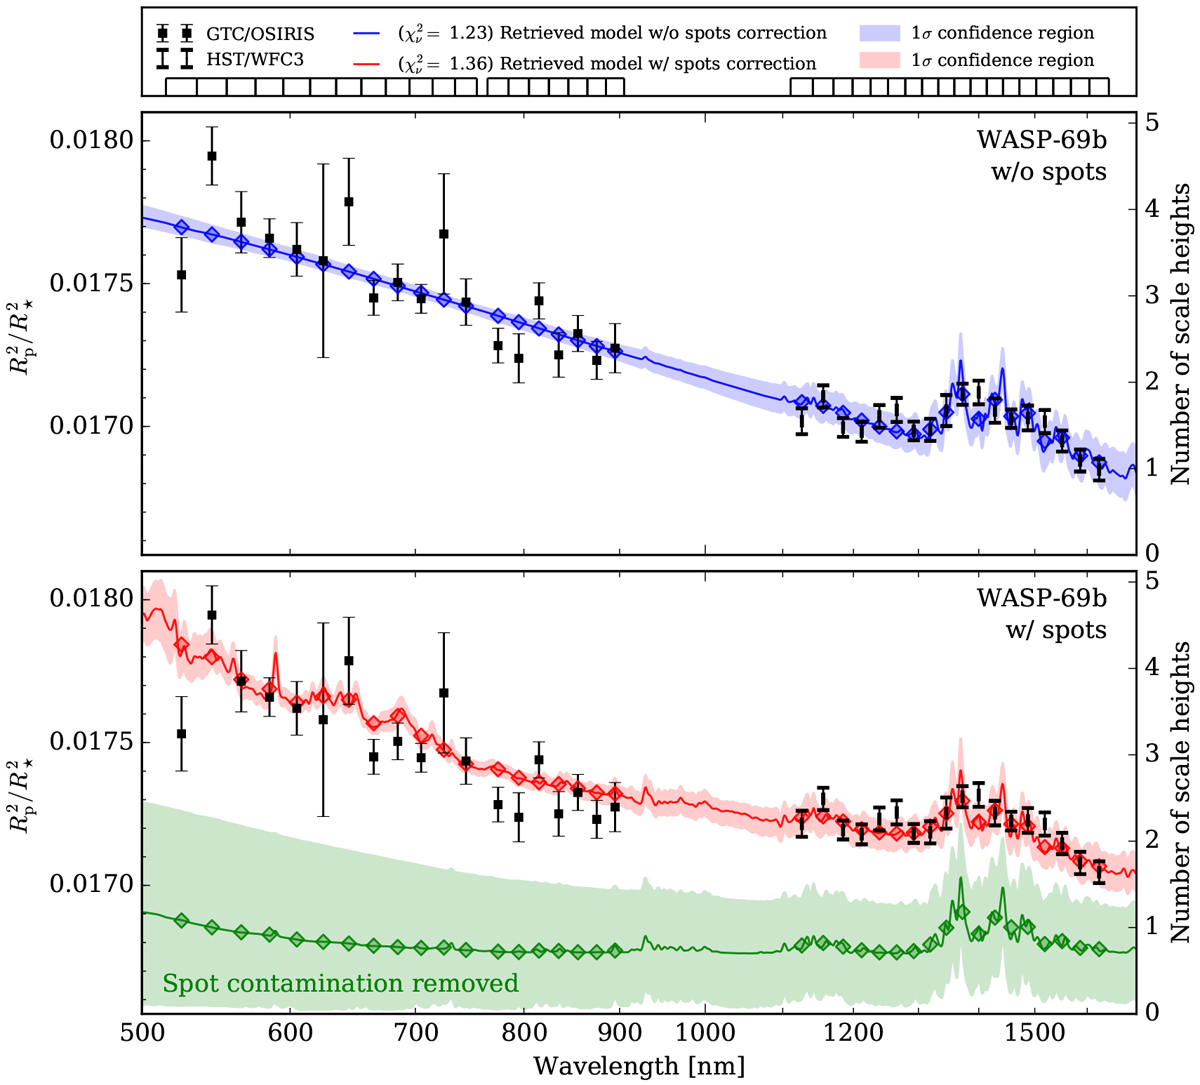
Optical and near-infrared transmission spectrum of WASP-69b (black squares) compared with the retrieved models from the PLATON code (Zhang et al. 2019). The shaded area presents the 1σ
confidence level of the retrieval analysis. Top panel: legend and the bins of bandpass used to derive the transmission spectrum. Middle panel: retrieval analysis assuming no spot contamination. Bottom panel: retrieval analysis with spot contamination, where the green model corresponds to the pure planetary atmospheric model after removing the spot contamination from the red model. The WFC3 data (Tsiaras et al. 2018) have been shifted upward by a constant value of
![]() ppm (middle panel) and 618 ppm (bottom panel), respectively, which is a free parameter in the retrieval analysis.
ppm (middle panel) and 618 ppm (bottom panel), respectively, which is a free parameter in the retrieval analysis.
Current usage metrics show cumulative count of Article Views (full-text article views including HTML views, PDF and ePub downloads, according to the available data) and Abstracts Views on Vision4Press platform.
Data correspond to usage on the plateform after 2015. The current usage metrics is available 48-96 hours after online publication and is updated daily on week days.
Initial download of the metrics may take a while.