Free Access
Fig. 6
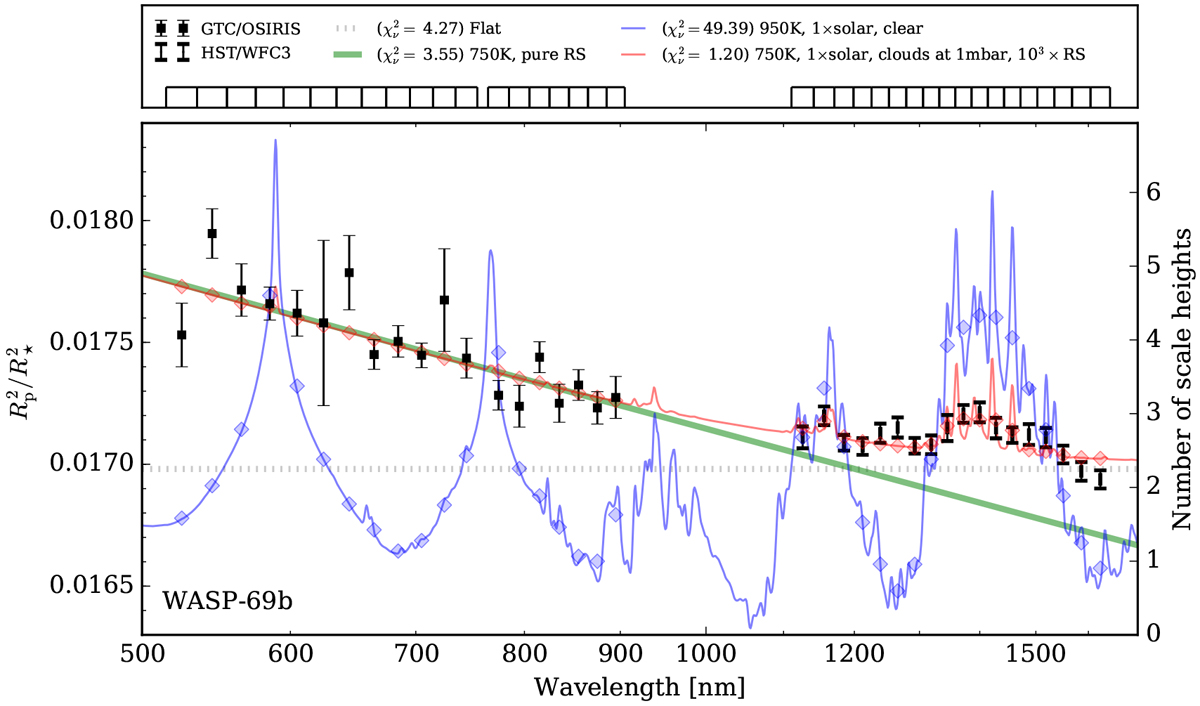
Optical and near-infrared transmission spectrum of WASP-69b (black squares) compared with the same theoretical atmosphere models explained in Fig. 5. The near-infrared data was obtained using WFC3 (Tsiaras et al. 2018). The WFC3 data have been shifted upward by a constant value of
![]() ppm.
ppm.
Current usage metrics show cumulative count of Article Views (full-text article views including HTML views, PDF and ePub downloads, according to the available data) and Abstracts Views on Vision4Press platform.
Data correspond to usage on the plateform after 2015. The current usage metrics is available 48-96 hours after online publication and is updated daily on week days.
Initial download of the metrics may take a while.