Fig. 5
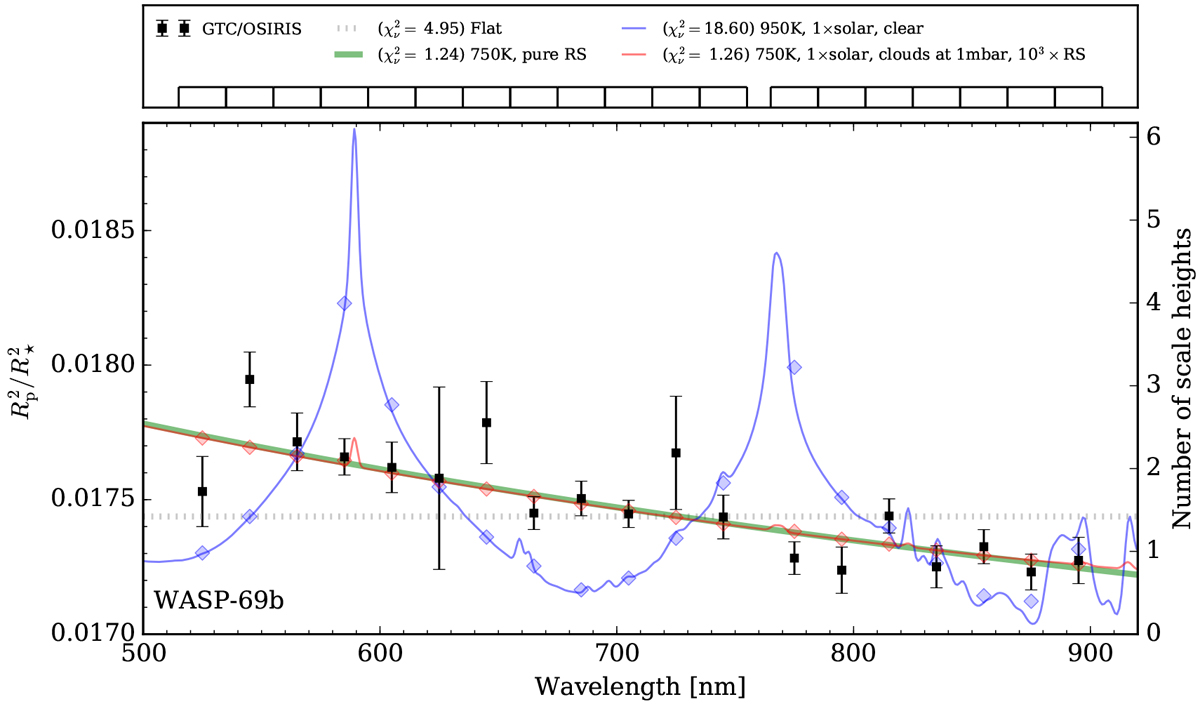
Optical transmission spectrum of WASP-69b (black squares) compared with several theoretical atmosphere models. In blue, a model created using Exo-Transmit (Kempton et al. 2017) for a clear atmosphere and solar abundance is shown. The gray dotted line indicates a model of flat transmission spectrum. The slope expected in an atmosphere affected solely by Rayleigh scattering is shown in green. In red, we show the model of an atmosphere with clouds at 1 mbar and Rayleigh scattering enhanced by a factor of 1000. Top panel: legend and the bins of bandpass to derive the transmission spectrum.
Current usage metrics show cumulative count of Article Views (full-text article views including HTML views, PDF and ePub downloads, according to the available data) and Abstracts Views on Vision4Press platform.
Data correspond to usage on the plateform after 2015. The current usage metrics is available 48-96 hours after online publication and is updated daily on week days.
Initial download of the metrics may take a while.