Fig. 4
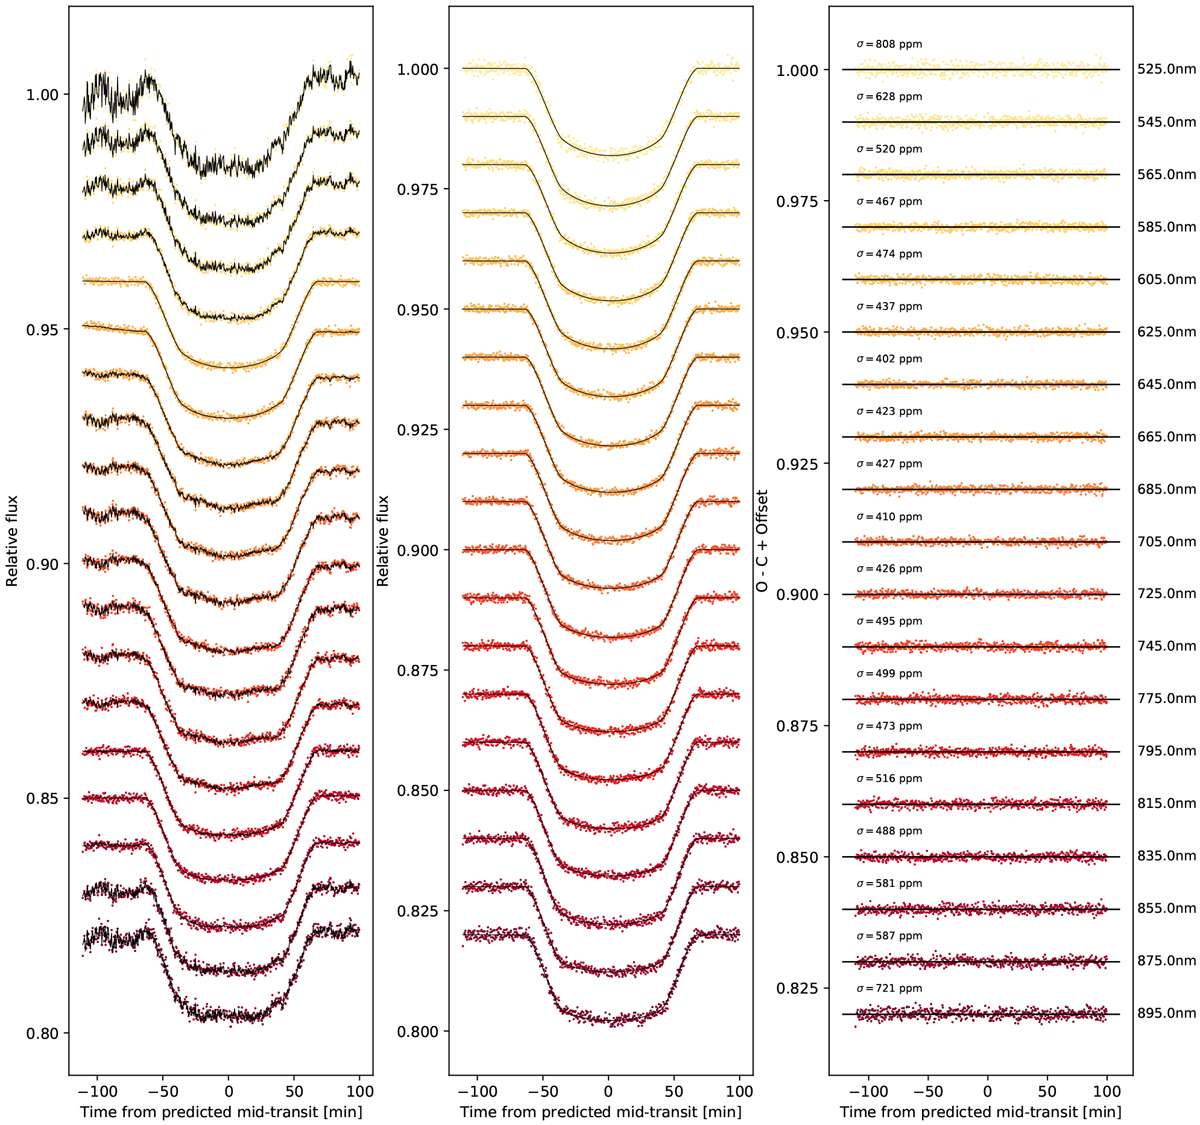
Left panel: all 19 spectroscopic light curves where common-mode noise has been removed, with the respective best fitting model (including transit light curve and noise model) plotted in black. Middle panel: same spectroscopic light curves after the model for systematic trends was removed. The best fitting transit model considering the red noise is plotted in black. Right panel: residuals after the best fitting models were subtracted.
Current usage metrics show cumulative count of Article Views (full-text article views including HTML views, PDF and ePub downloads, according to the available data) and Abstracts Views on Vision4Press platform.
Data correspond to usage on the plateform after 2015. The current usage metrics is available 48-96 hours after online publication and is updated daily on week days.
Initial download of the metrics may take a while.