Fig. 3
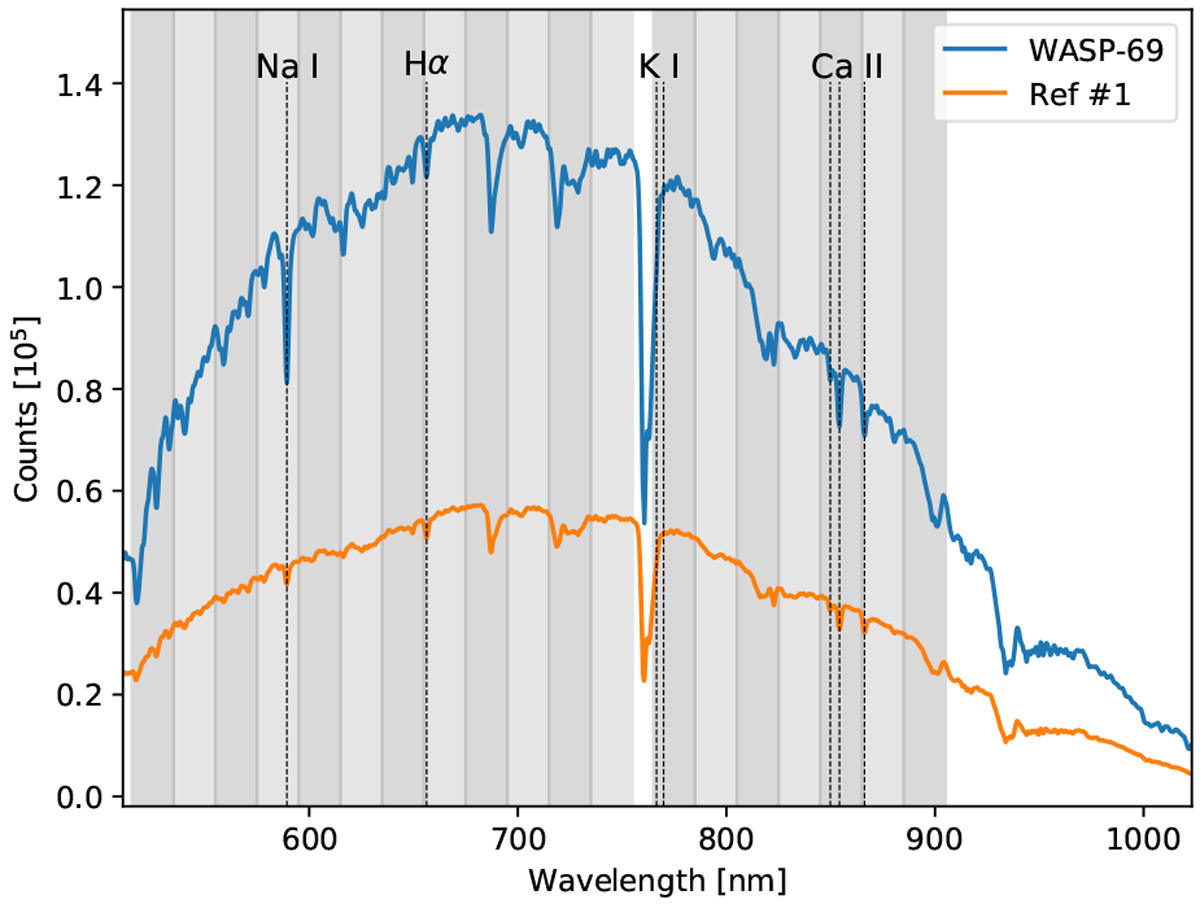
Sample spectra of WASP-69 (blue) and the reference star (orange). The limits of the narrow pass bands used to create the 19 spectrophotometric light curves are indicated in gray lines. The position of several strong atmospheric lines are also marked. The spectral region at 760 nm is excluded from narrow pass bands as it is strongly affected by telluric oxygen absorption, introducing noise to the data.
Current usage metrics show cumulative count of Article Views (full-text article views including HTML views, PDF and ePub downloads, according to the available data) and Abstracts Views on Vision4Press platform.
Data correspond to usage on the plateform after 2015. The current usage metrics is available 48-96 hours after online publication and is updated daily on week days.
Initial download of the metrics may take a while.