Fig. 2
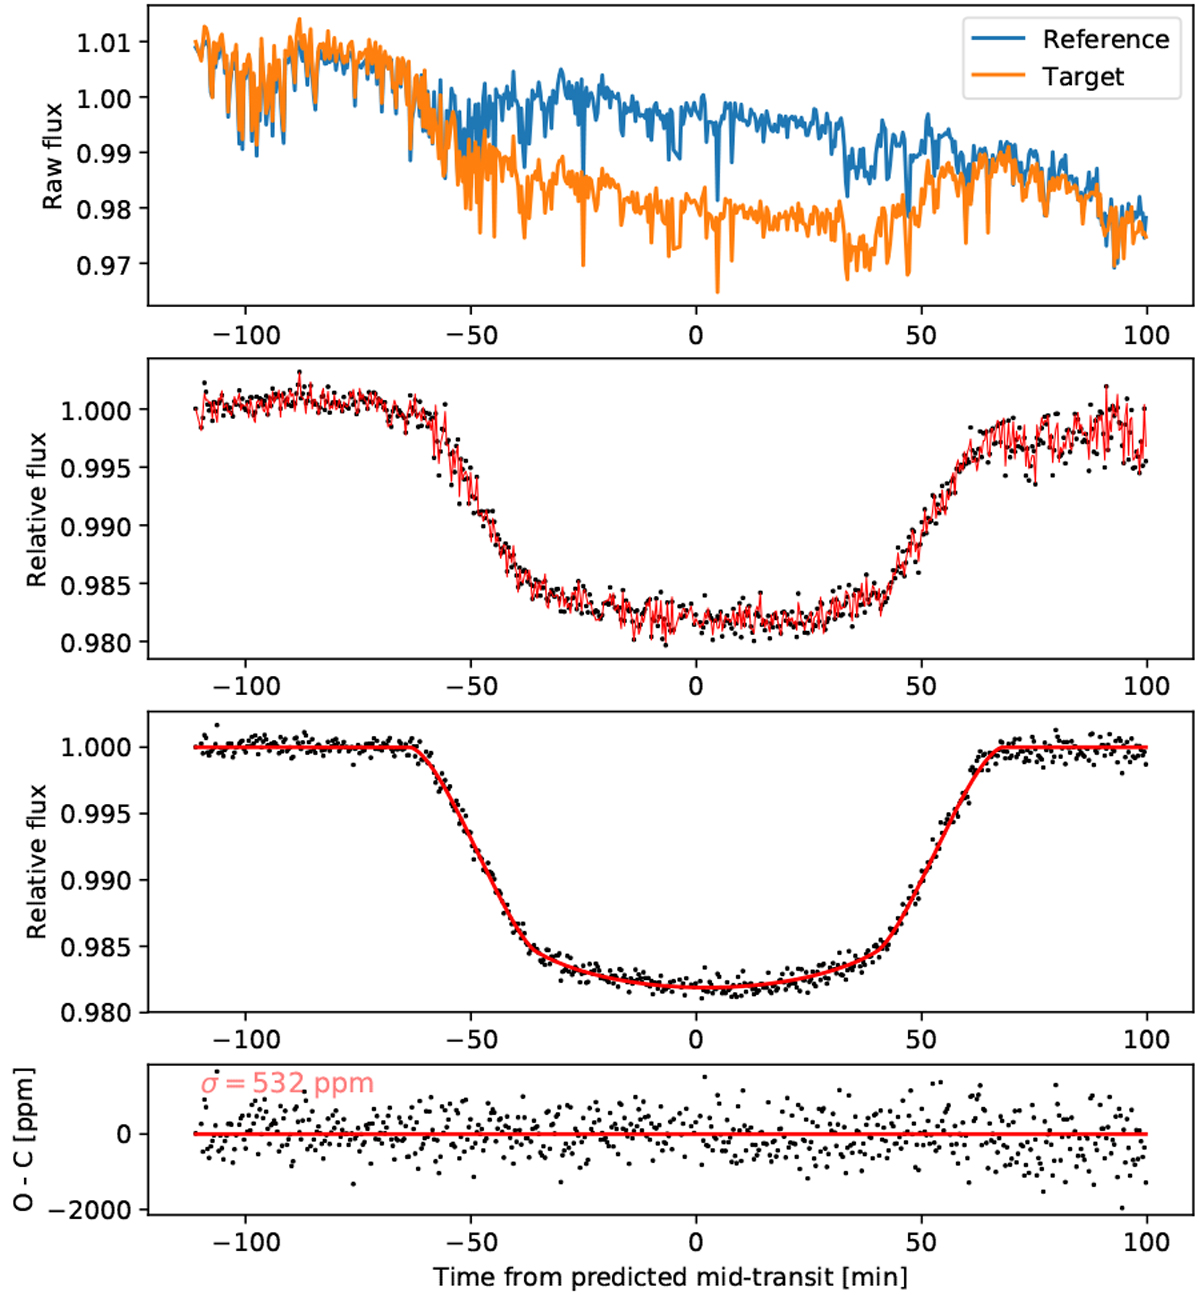
White light transit curve of WASP-69b. Upper panel: raw light curve of WASP-69 (orange) and the reference star (blue). Second panel from the top: relative white light curve (black points) with best fitting model (in red), including the modeledtransit curve and components to model the effects of seeing and other systematic noise sources. Third panel from the top: relative white light curve with the modeled noise components removed. The best fitting transit model is plotted in red. Bottom panel: residuals after the best fitting model is subtracted from the data are plotted in black with a red line indicating the zero level. The scatter of the residuals is 532 ppm.
Current usage metrics show cumulative count of Article Views (full-text article views including HTML views, PDF and ePub downloads, according to the available data) and Abstracts Views on Vision4Press platform.
Data correspond to usage on the plateform after 2015. The current usage metrics is available 48-96 hours after online publication and is updated daily on week days.
Initial download of the metrics may take a while.