Fig. 2.
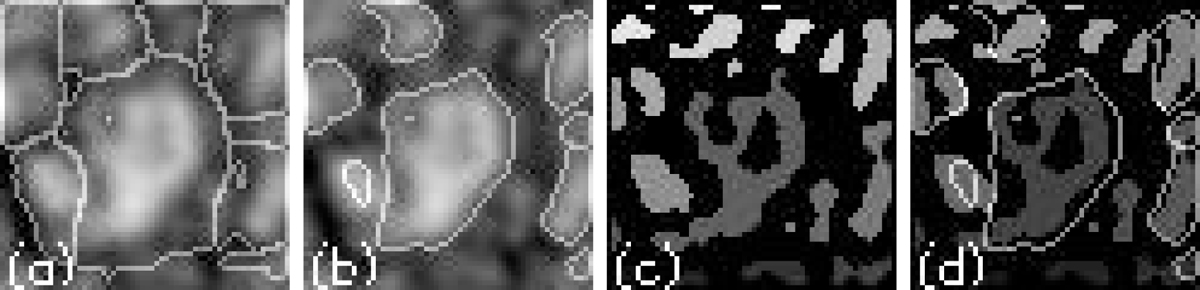
Granules and cell boundaries obtained via various methods. Panel a: cell boundary obtained by the watershed segmentation algorithm. Panel b: application of the erosion operator on image (a) gives new cell limits. Panel c: granule upflows (bright part) detection by the Bovelet algorithm. Panel d: superposition of the granule border shown in image (b) and granules detected in image (c).
Current usage metrics show cumulative count of Article Views (full-text article views including HTML views, PDF and ePub downloads, according to the available data) and Abstracts Views on Vision4Press platform.
Data correspond to usage on the plateform after 2015. The current usage metrics is available 48-96 hours after online publication and is updated daily on week days.
Initial download of the metrics may take a while.