Fig. 19.
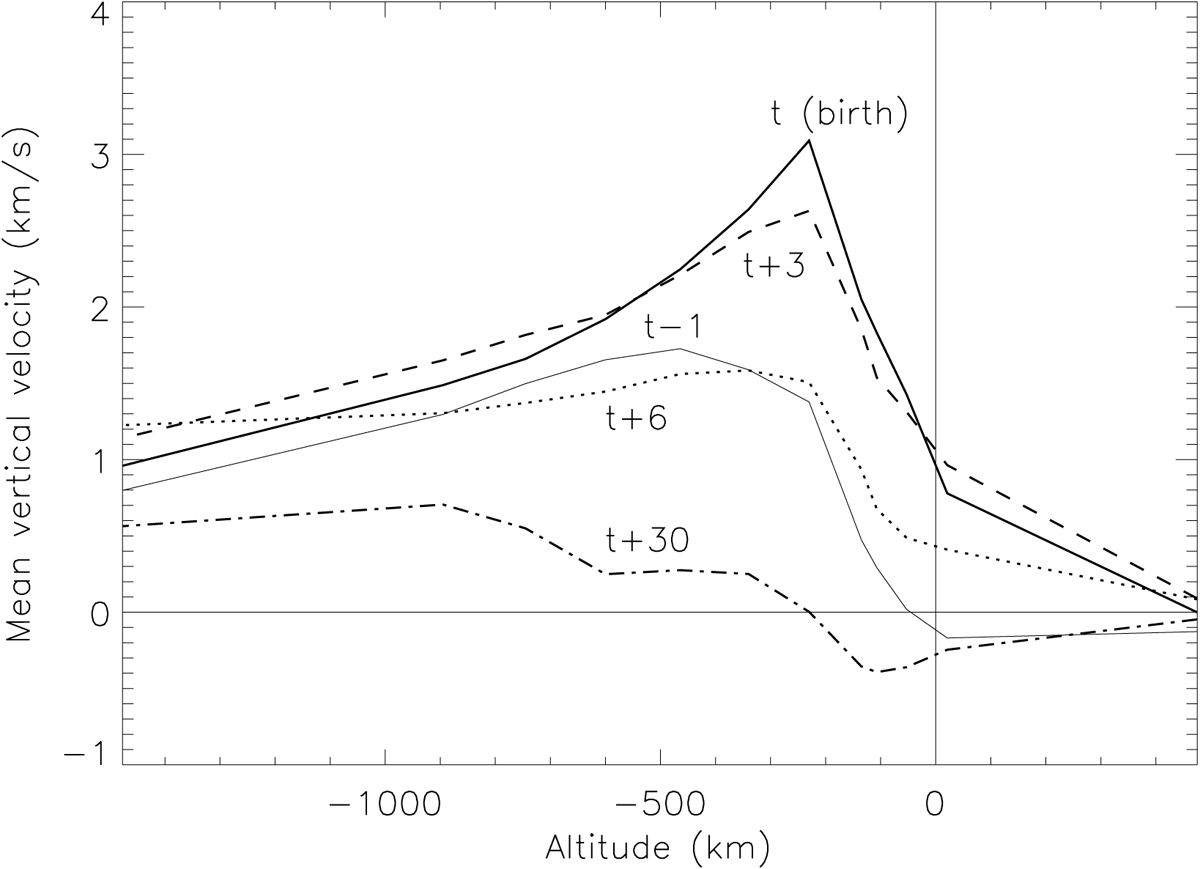
Temporal evolution of the average vertical velocity in depth, from −1500 km to +500 km, the surface being at 0 km, computed from 48 exploding granules at their center. On the surface Vz is at 0.9 km s−1, but there is a peak at 3 km s−1 at 200 km below the surface at the birth of the granule. The different curves correspond first to the onset of granule parent at t(birth)−1 min up to t(birth)+30 min. We observe a clear increase in the upflow velocity just before the birth of the exploding granule at z = 0 (surface) and then a monotonic decrease in time of the Vz component.
Current usage metrics show cumulative count of Article Views (full-text article views including HTML views, PDF and ePub downloads, according to the available data) and Abstracts Views on Vision4Press platform.
Data correspond to usage on the plateform after 2015. The current usage metrics is available 48-96 hours after online publication and is updated daily on week days.
Initial download of the metrics may take a while.