Fig. 17.
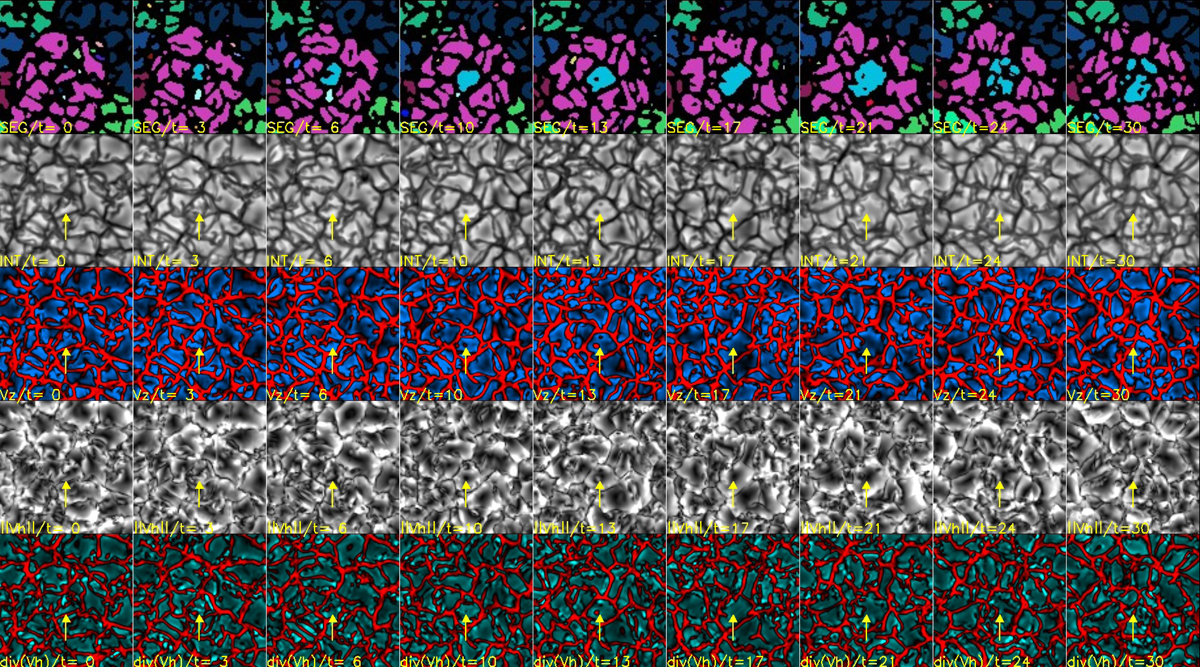
Typical parent granule issued from the numerical simulation, at the origin of the formation of a large TFG. From left to right: time t = 0 (birth), 3, 6, 10 (growing phase), 13, 17, 21, 24 (explosion), and 30 min. The FOV is 9.6 Mm × 9.6 Mm. Line 1: intensity segmentation (the exploding granule is shown in blue); line 2: emerging intensity (in gray); line 3: vertical velocity: redshifts (downflow) and blueshifts (upflow); line 4: horizontal velocity module (in gray); line 5: horizontal velocity divergence (red for converging flow, blue for diverging flow). The arrows indicate the location of the exploding granule.
Current usage metrics show cumulative count of Article Views (full-text article views including HTML views, PDF and ePub downloads, according to the available data) and Abstracts Views on Vision4Press platform.
Data correspond to usage on the plateform after 2015. The current usage metrics is available 48-96 hours after online publication and is updated daily on week days.
Initial download of the metrics may take a while.