Fig. 8.
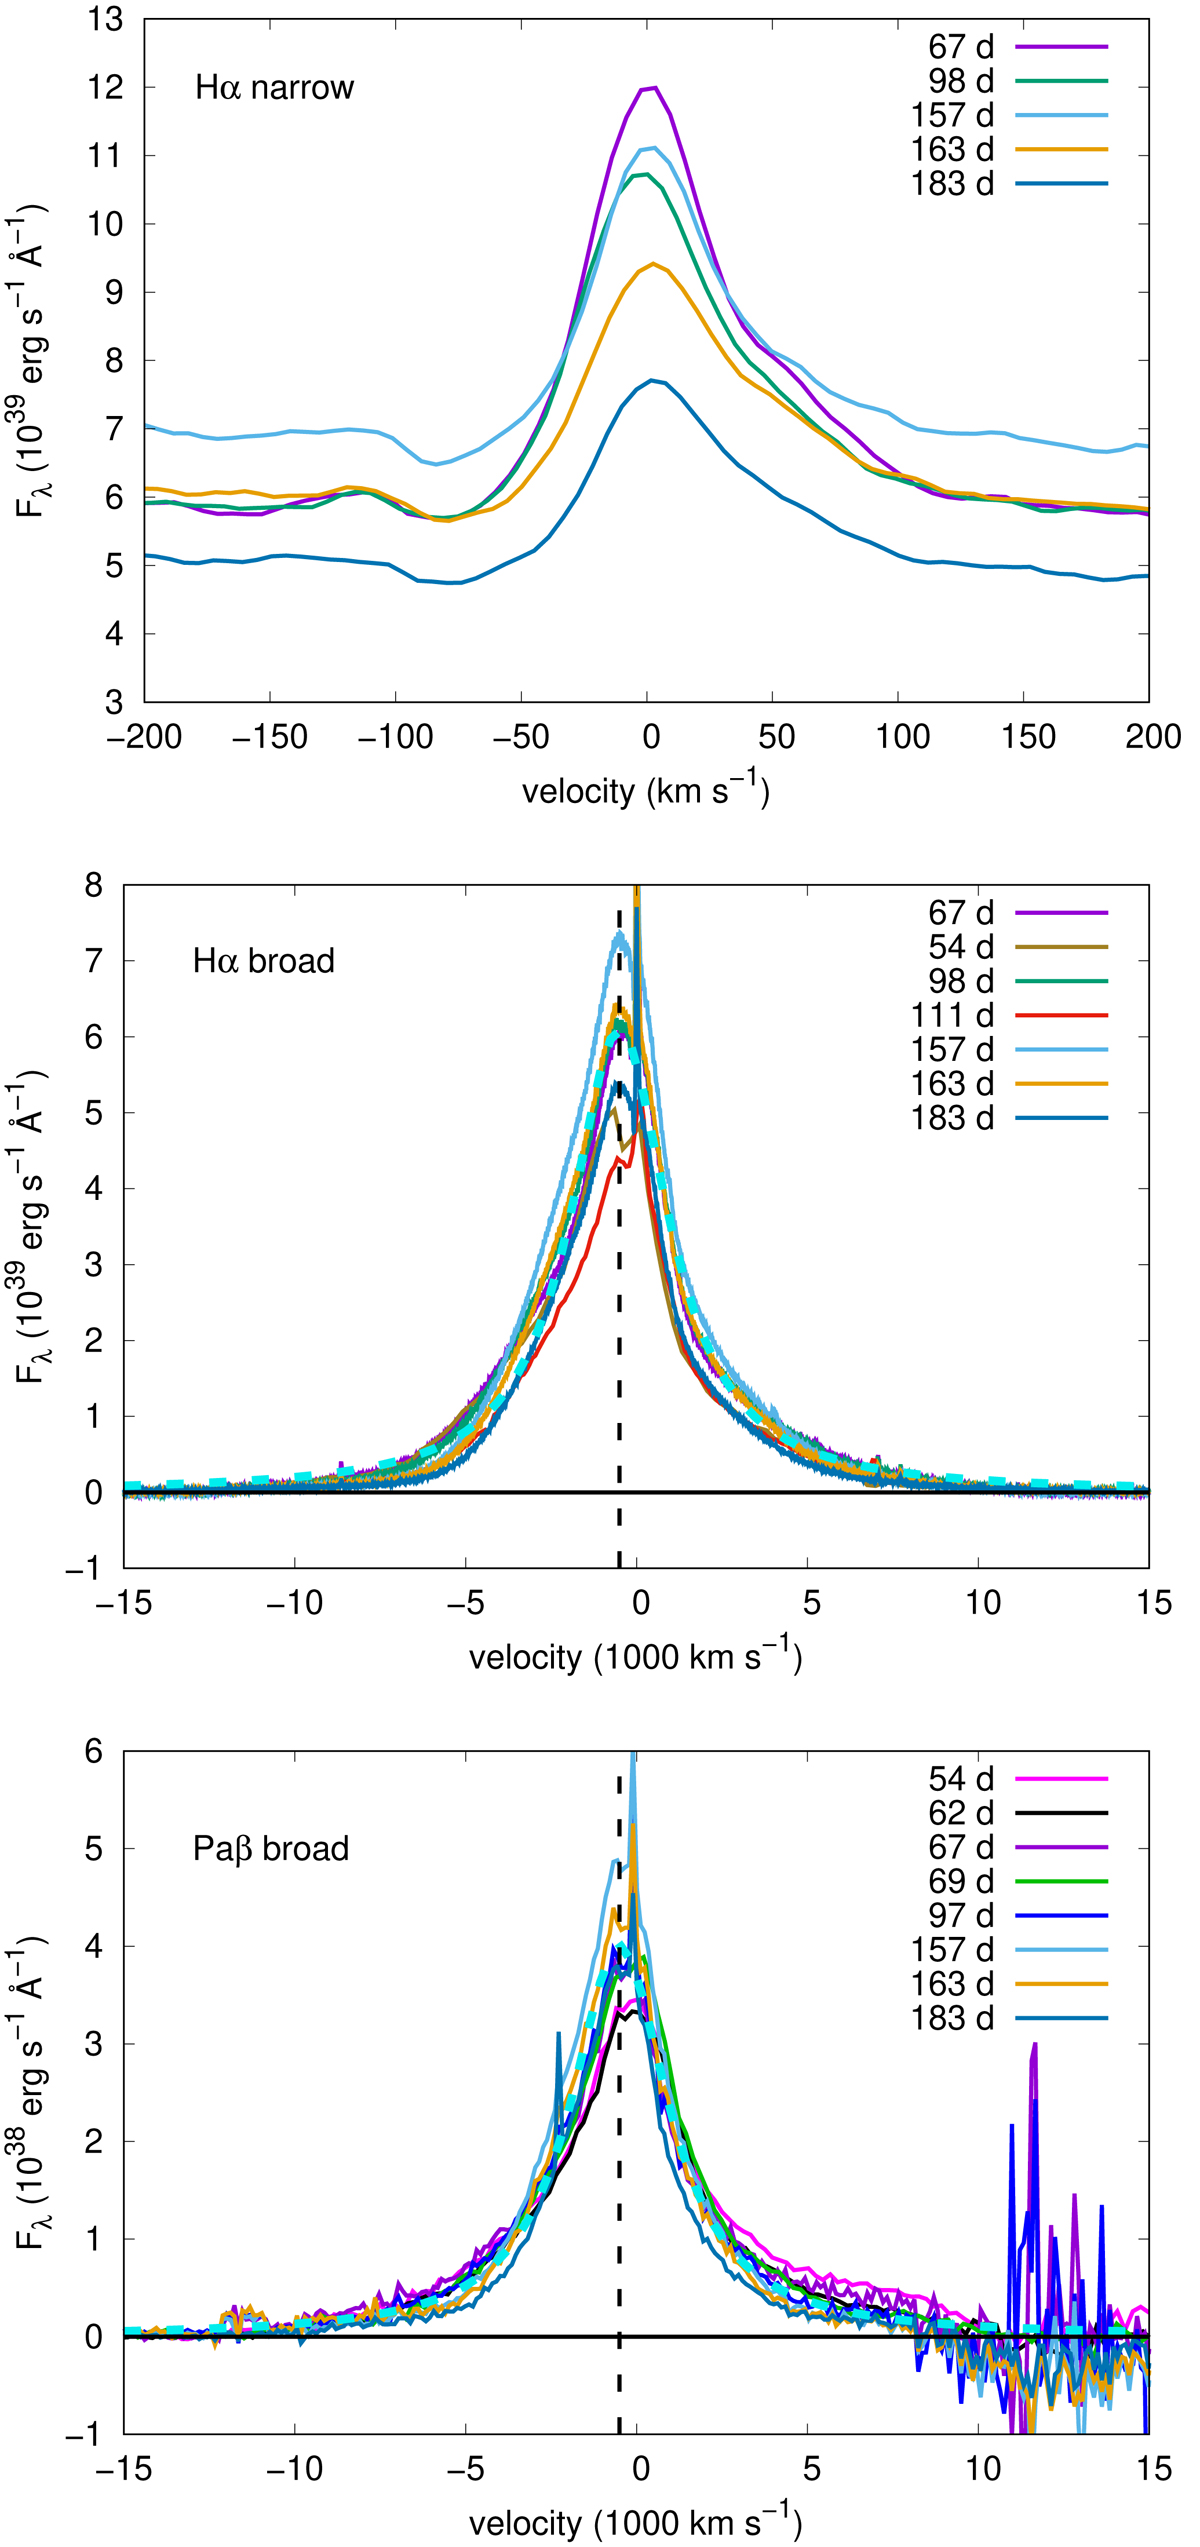
Time-evolution of the narrow- (top panel) and broad-component (middle panel) Hα profiles, and the broad-component (bottom panel) of the Pa-β profile, plotted in velocity space. Over-plotted as dashed cyan lines are Lorentzian functions with the FWHM velocity of 3500 km s−1 and the peak shifted by −500 km s−1. The redshift is determined by the average of the narrow emission peak. Both broad components are overall symmetric and do not exhibit significant evolution over the duration of our followup observations.
Current usage metrics show cumulative count of Article Views (full-text article views including HTML views, PDF and ePub downloads, according to the available data) and Abstracts Views on Vision4Press platform.
Data correspond to usage on the plateform after 2015. The current usage metrics is available 48-96 hours after online publication and is updated daily on week days.
Initial download of the metrics may take a while.